A-Level課程可以自學嗎?自學A-Level課程需要具備哪些特質?
在一堆國際考試中,Alevel課程被認定為是最簡單的課程之一。那么,“簡單”的Alevel課程能不能自學呢? 事實上,A-Level是可以自學的,但是難度會相對大一些,而且對學生自律性的要求會比較嚴格。那么,首先我們先...

在一堆國際考試中,Alevel課程被認定為是最簡單的課程之一。那么,“簡單”的Alevel課程能不能自學呢? 事實上,A-Level是可以自學的,但是難度會相對大一些,而且對學生自律性的要求會比較嚴格。那么,首先我們先...
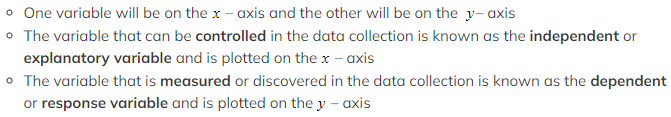
Scatter Diagrams What does bivariate data mean? A lot of statistics is about looking at how different factors, or?variables?change how data behaves Bivariate data?is data which is collected on two ...
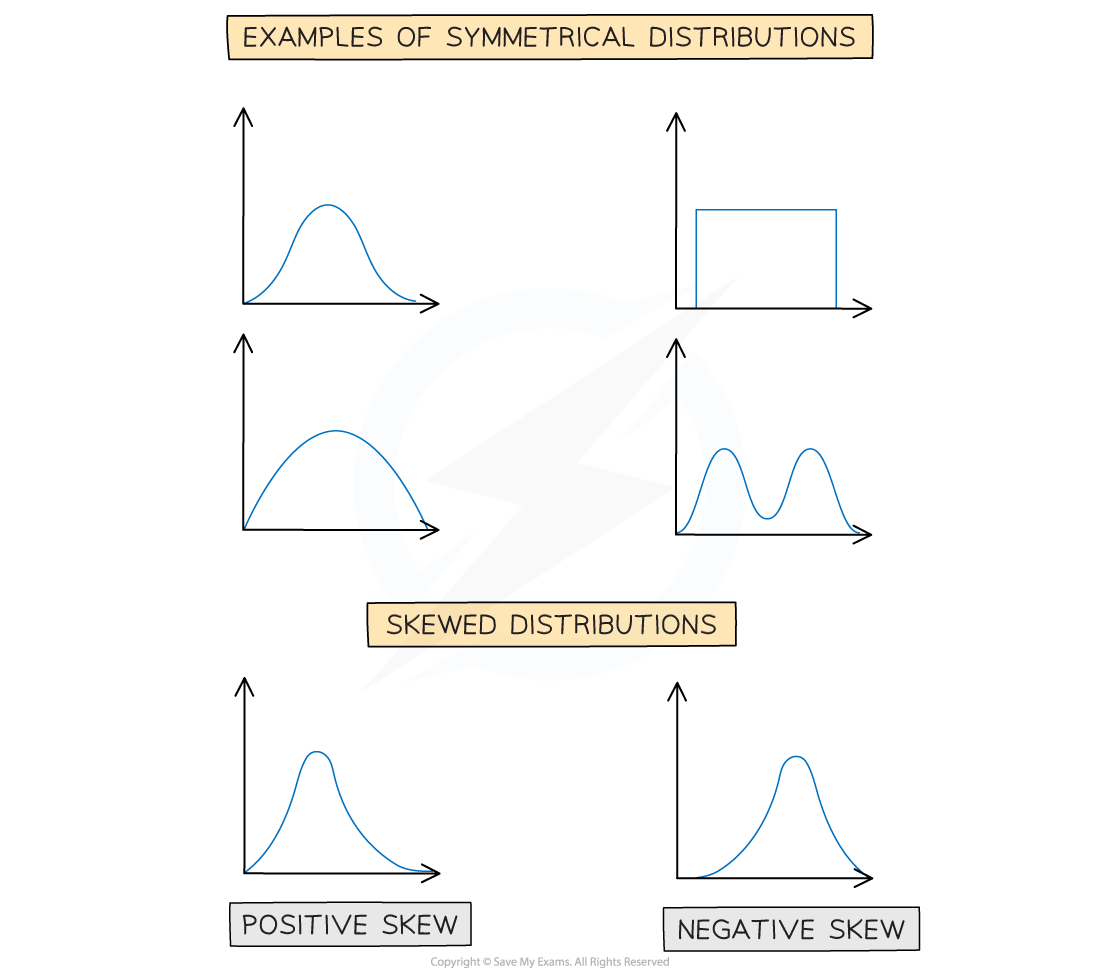
Skewness The distribution of a data set is either symmetrical or it has skewness. What is skewness? Skewness describes the way in which data in a non – symmetrical distribution is leaning A distrib...
Interpreting Data You may be asked to comment on how statistics could affect data or how removing or adding a new piece of data could change statistics you have calculated. You may also be asked to...
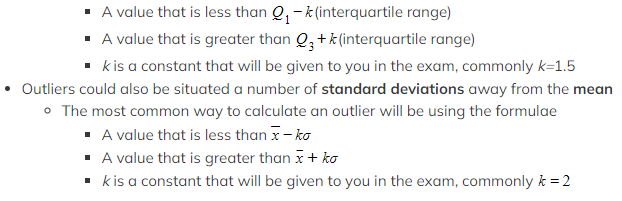
Outliers What are outliers? Outliers are extreme data values that do not fit with the general pattern of the data They can come from one or two extreme events or from mistakes in the data collectio...
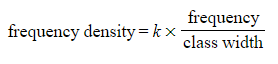
Histograms What is a histogram? A histogram is similar to a bar chart but with some?key differences A histogram is for displaying?grouped continuous data?whereas a bar chart is for?discrete?or?qual...
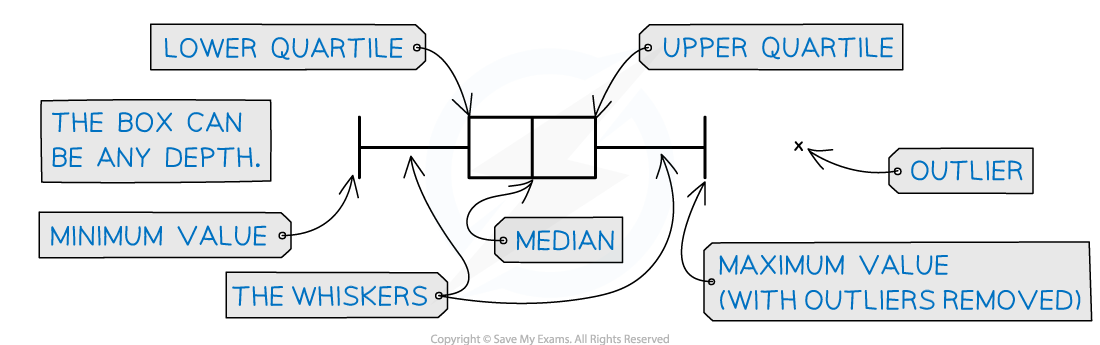
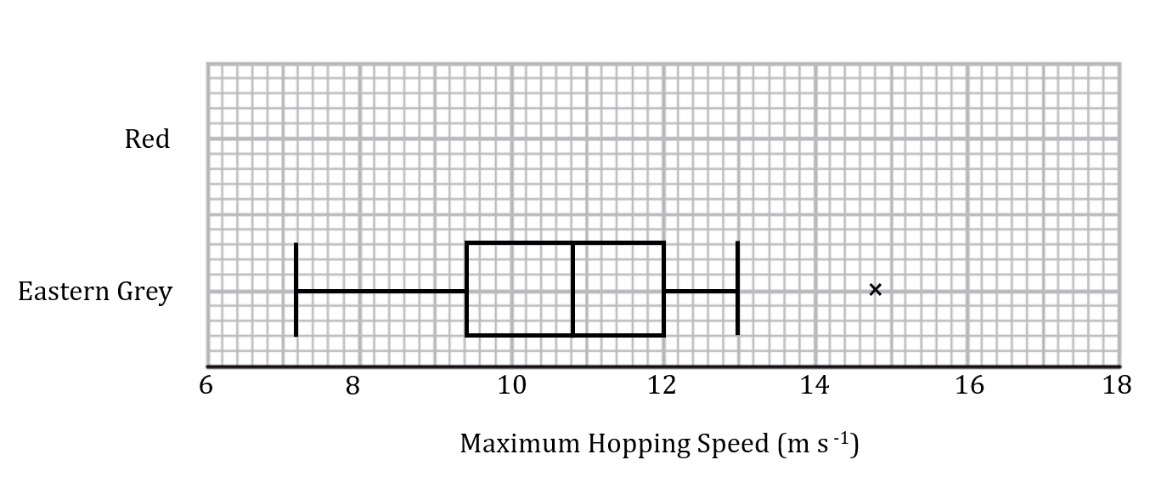
Box Plots What is a box plot? A box plot is a graph that clearly shows key statistics from a data set It shows the?median, quartiles, minimum?and?maximum values?and?outliers It does not show any ot...
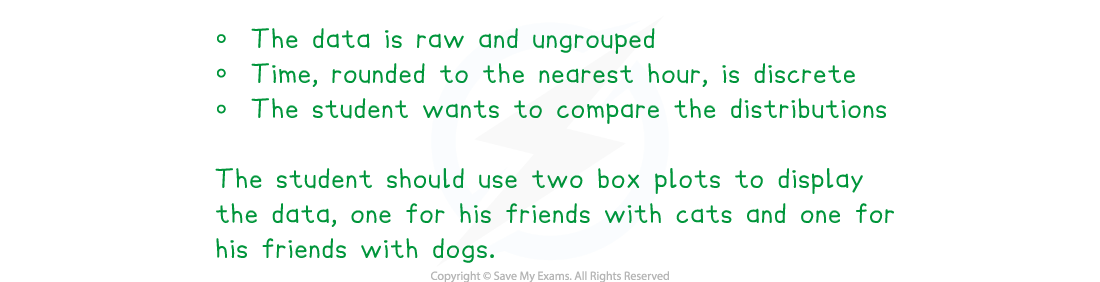
Data Presentation What graphs and diagrams should I be familiar with? You will be expected to be able to use a variety of graphs such as: Box plots Can be used with ungrouped data of a single varia...
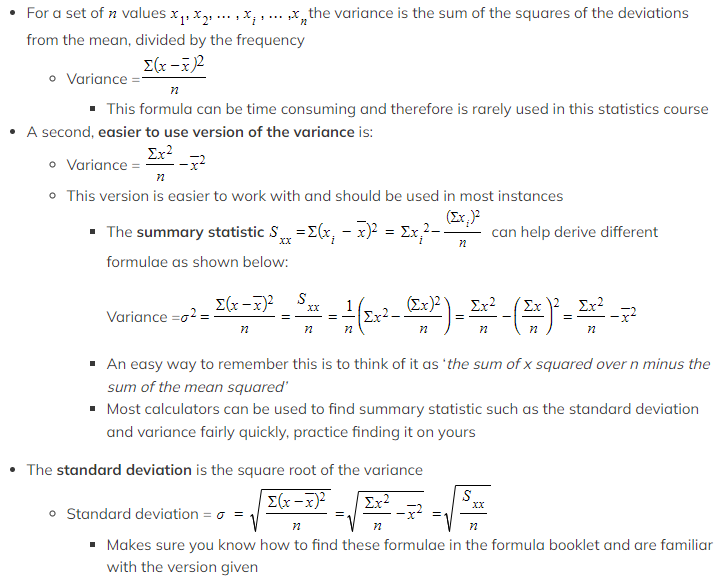
Standard Deviation & Variance The?variance?is another measure for the spread of the data, it measures the variability from the mean of the data. What is the variance and the standard deviation?...


