AQA A Level Biology復習筆記3.2.11 Correlations & Causal Relationships - The Lungs

Correlations & Causal Relationships - The Lungs
- Correlation?is an association or relationship between variables
- Causation?occurs when one variable has an influence or is influenced by another
- There is a clear distinction between correlation and causation:?a correlation does not necessarily imply a causative relationship
Recognising Correlations and Causal Relationships
- Scientists present their findings from experiments in?graphical?and?numerical?forms to identify if there are relationships between risk factors and certain disease
- Scatter?diagrams?are used to identify?correlations?between two variables to determine if a factor (such as obesity) does increase the?risk?of developing a disease (such as type 2 diabetes)
- In this example, BMI would be on the x-axis and Incidence of Type 2 Diabetes on the y-axis
- It is important to note that not everyone with a high BMI will develop Type 2 Diabetes, however more people with a high BMI will develop Type 2 Diabetes than those with low BMI
- Correlation can be?positive or negative
- Positive correlation: as variable A increases, variable B increases
- Negative correlation: as variable A increases, variable B decreases
- If there is?no correlation?between variables the?correlation coefficient will be 0
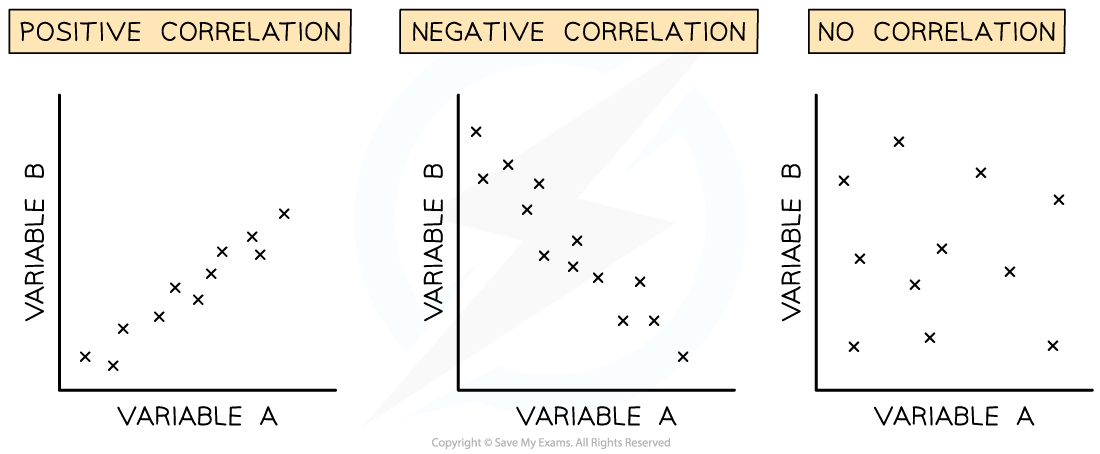
Image showing different types of correlation in scatter graphs
Risk factors & causal relationships for lung diseases
- A?causal?relationship has been proven for some risk factors relating to lung diseases
- It is proven that?smoking?is a major risk factor for developing lung diseases such as emphysema
- The chemicals in cigarettes damage the lungs and airways, making individuals more prone to developing the disease
- This has been verified by other scientific investigations that have linked the chemicals to the damage which in turn leads to the disease
- Risk factors that are more easily controlled and measured are more likely to have a proven causal relationship, as they can be investigated in a more scientific manner
- For example, an individual’s exposure to smoking is much easier to quantify than their exposure to air pollution
- When analysing data and studies it is always important to remember that?risk factors interact with each other
- For example, a smoker with asthma is likely to suffer the associated negative health side effects more quickly than a smoker without asthma
- It is always important to remember that even though there is a correlation, this does not mean that there is a direct causal link
- For example, in places with higher pollution, there may be more asthmatic individuals but this does not mean that pollution caused asthma as there are many other variables at play
Exam Tip
You should be able to?translate?information between?graphical?and?numerical?forms and extract and interpret information from?charts,?graphs?and?tables?to determine risk factors.
轉載自savemyexams
以上就是關于【AQA A Level Biology復習筆記3.2.11 Correlations & Causal Relationships - The Lungs】的解答,如需了解學校/賽事/課程動態,可至翰林教育官網獲取更多信息。
往期文章閱讀推薦:
MIT官方發布【2026年夏季推薦閱讀書單】!橫跨科學/人文/經濟...


翰林AMC8視頻課重磅上線!

國際競賽真題資源免費領取






