AQA A Level Chemistry復習筆記5.2.7 Rate-Concentration Graphs

Rate-Concentration Graphs
Order of reaction from initial rate
- The?progress?of the reaction can be followed by measuring the?initial?rates?of the reaction using various?initial concentrations?of each reactant
- These rates can then be plotted against time in a rate-time graph
- In a?zero-order?reaction the rate doesn’t depend on the concentration of the reactant
- The rate of the reaction therefore remains constant throughout the reaction
- The graph is a?horizontal line
- The rate equation is?rate =?k
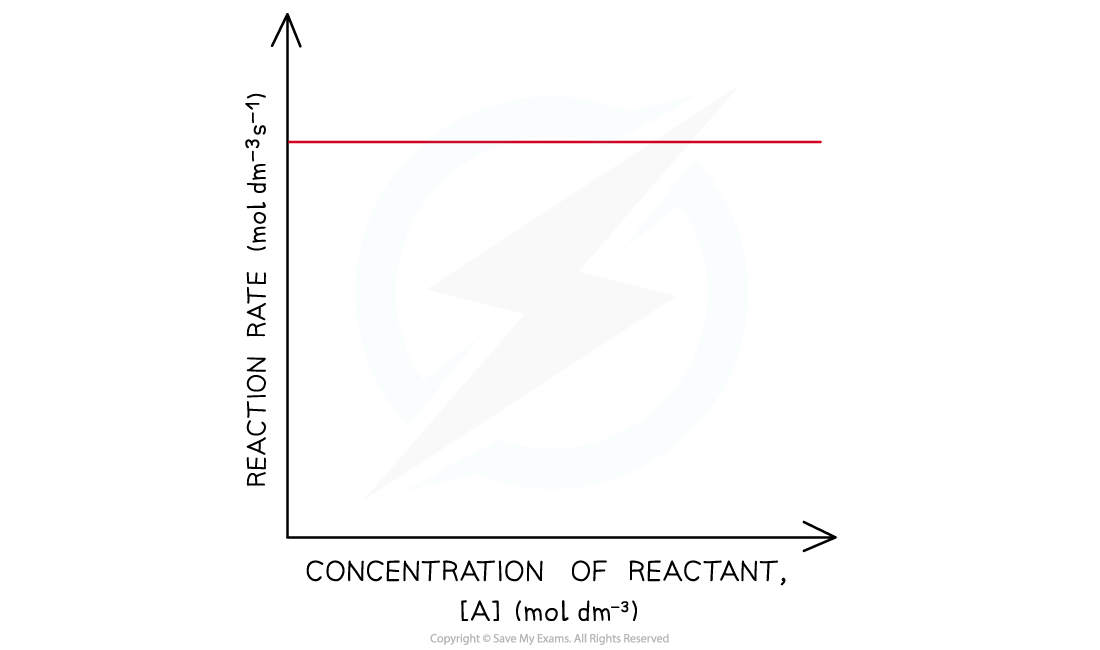
Rate-concentration graph of a zero-order reaction
- In a?first-order?reaction the rate is directly proportional to the concentration of a reactant
- The rate of the reaction increases as the concentration of the reactant increases
- This means that the rate of the reaction decreases as the concentration of the reactant decreases when it gets used up during the reaction
- The graph is a?straight line
- The rate equation is?rate =?k?[A]
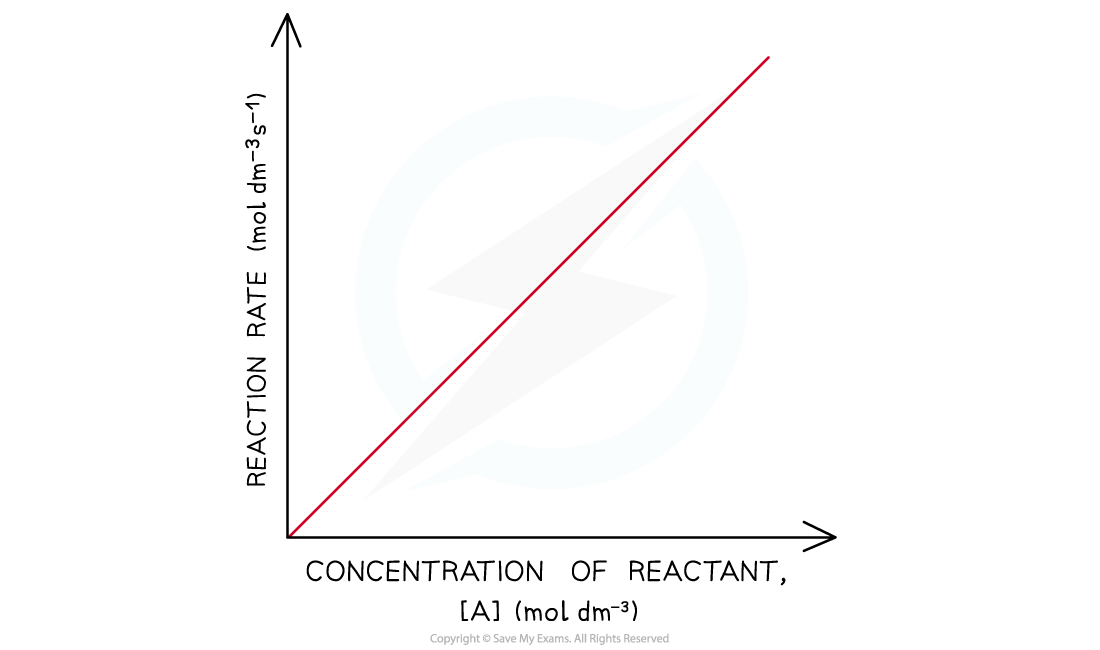
Rate-concentration graph of a first-order reaction
- In a?second-order?reaction, the rate is directly proportional to the square of concentration of a reactant
- The rate of the reaction increases more as the concentration of the reactant increases
- This means that the rate of the reaction decreases more as the concentration of the reactant decreases when it gets used up during the reaction
- The graph is a?curved line
- The rate equation is?rate =?k?[A]2
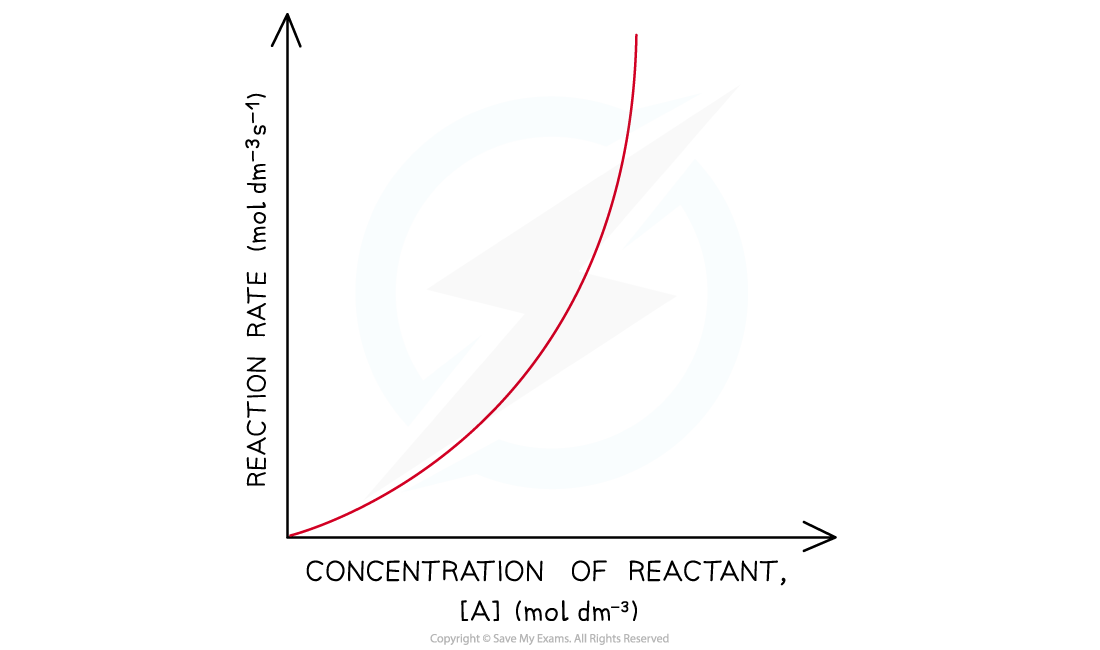
Rate-concentration graphs of a second-order reaction
Exam Tip
Careful - sometimes when asked to complete calculations for k, the exam question will give you a graph which demonstrates the order of one of the reactants, as well as tabulated data to determine the order for the other reactants. Do not ignore the graph.
轉載自savemyexams
以上就是關于【AQA A Level Chemistry復習筆記5.2.7 Rate-Concentration Graphs】的解答,如需了解學校/賽事/課程動態,可至翰林教育官網獲取更多信息。
往期文章閱讀推薦:
MIT官方發布【2026年夏季推薦閱讀書單】!橫跨科學/人文/經濟...


翰林AMC8視頻課重磅上線!

國際競賽真題資源免費領取






