IB DP Chemistry: HL復習筆記11.1.3 Nuclear Magnetic Resonance Spectroscopy

How NMR works
- Nuclear Magnetic Resonance (NMR)?spectroscopy is used for analysing organic compounds
- Only atoms with?odd?mass numbers?show signals on?NMR?spectra and have the property of?nuclear?spin
- In?1H NMR, the magnetic field strengths of protons in organic compounds are measured and recorded on a spectrum
- Samples are irradiated with radio frequency energy while subjected to a strong magnetic field
- The nuclei can align themselves with or against the magnetic field
- Protons on different parts of a molecule (in different molecular environments) absorb and emit (resonate) different radio frequencies
- All samples are measured against a reference compound –?Tetramethylsilane (TMS)
- TMS shows a single sharp peak on an?NMR?spectrum, at a value of zero
- Sample peaks are then plotted as a ‘shift’ away from this reference peak
- This gives rise to ‘chemical shift’ values for protons on the sample compound
- Chemical shifts are measured in?parts per million (ppm)
Features of a NMR spectrum
- An?NMR?spectrum shows the intensity of each peak against their chemical shift
- The area under each peak is proportional to the number of protons in a particular environment
- The height of each peak shows the intensity/absorption from protons
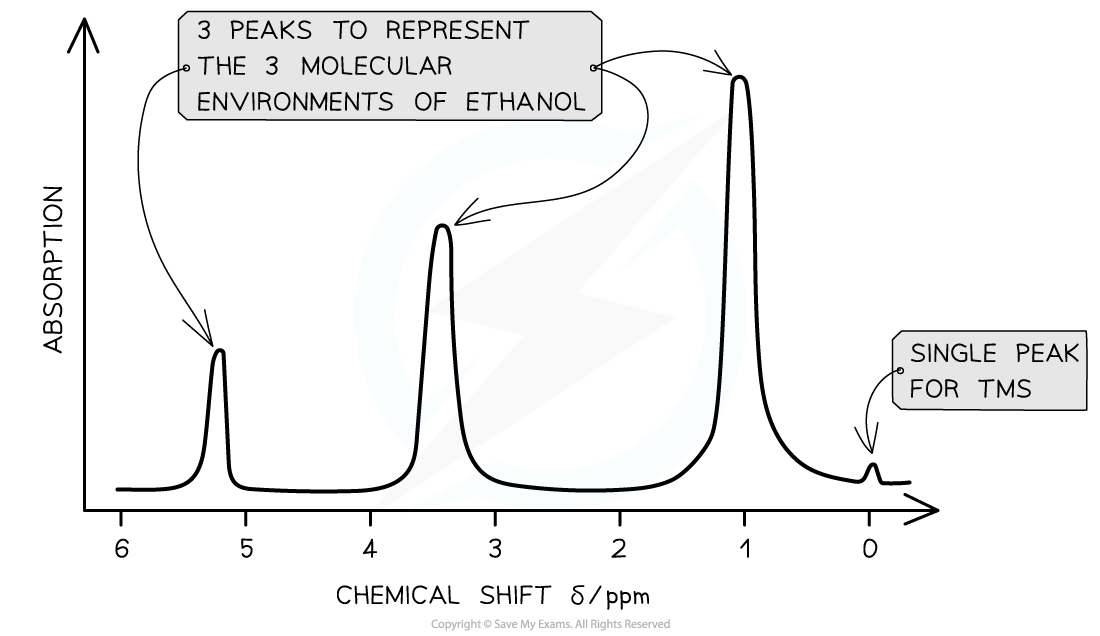
A low resolution?1H NMR for ethanol showing the key features of a spectrum
Chemical Environments
Chemical environments
- Hydrogen atoms of an organic compound are said to reside in different chemical environments
- Eg. Methanol has the molecular formula CH3OH
- There are 2 environments: -CH3?and -OH
- The hydrogen atoms in these environments will appear at 2 different chemical shifts
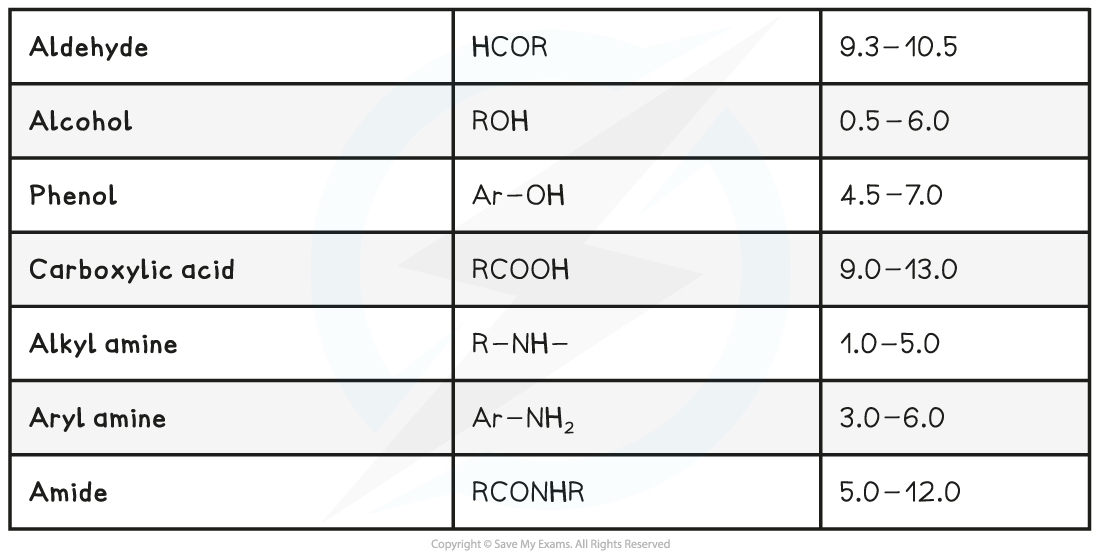
- Different types of protons are given their own range of chemical shifts
Exam Tip
Typical proton chemical shift values are given in Section 27 of the IB Chemistry Data Booklet. The values alone do not identify specific protons as the values occur over a range that is sometimes overlapping, but they can be used in combination with other structural information to help confirm a feature
Interpreting an NMR Spectrum
- Protons in the same environment are chemically equivalent
- Each peak on a NMR spectrum relates to protons in the same environment
- Peaks on a low resolution NMR spectrum refers to environments of an organic compound
- Eg. Ethanol has the molecular formula CH3CH2OH
- This molecule as 3 separate environments: -CH3, -CH2, -OH
- So 3 peaks would be seen on its spectrum at 1.2 ppm (-CH3), 3.7 ppm (-CH2) and 5.4 ppm (-OH)
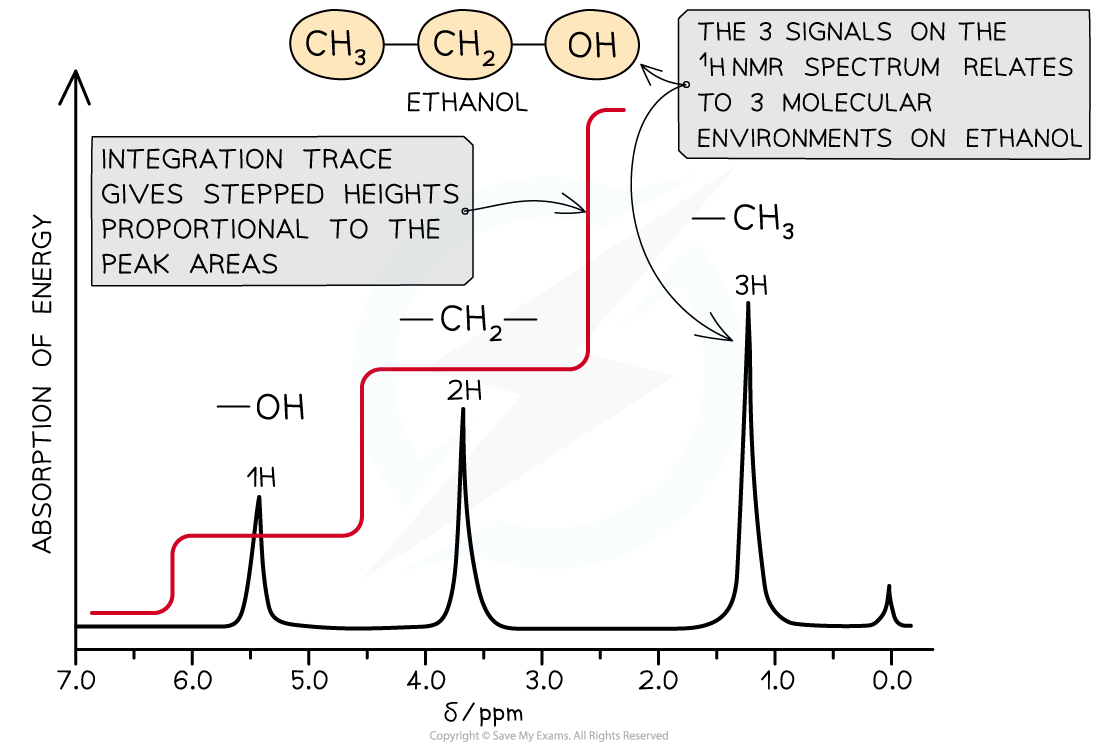
A low resolution NMR spectrum with integration trace
- The area under each peak is determined by computer and an?integration trace?overlaid on the spectrum
- The?integration trace?has stepped lines whose steps are in the same proportion as the peak areas
- This makes it easier to determine the relative abundance of the different proton environments
Worked Example
Which of the following features can be found from a?1H NMR spectrum?
A. ?The total mass of hydrogen atoms present
B. ?The number of different hydrogen environmentsC. ?The frequency vibration of C–O bonds
D. ?The first ionization energy of hydrogen
Answer:
The correct option is B.
-
- An NMR spectrum can tell you about the type of hydrogen environments and the relative proportion of the Hs in those environments
轉載自savemyexams

國際競賽真題資源免費領取


美高學分項目重磅來襲!立即了解