IB DP Physics: HL復習筆記12.2.7 Measuring Half-Life

Measuring Half-Life
- Half-life is defined as:
The time taken for the initial number of nuclei to halve for a particular isotope
- This means when a time equal to the half-life has passed, the?activity?of the sample will also half
- This is because the activity is proportional to the number of undecayed nuclei,?A?∝?N
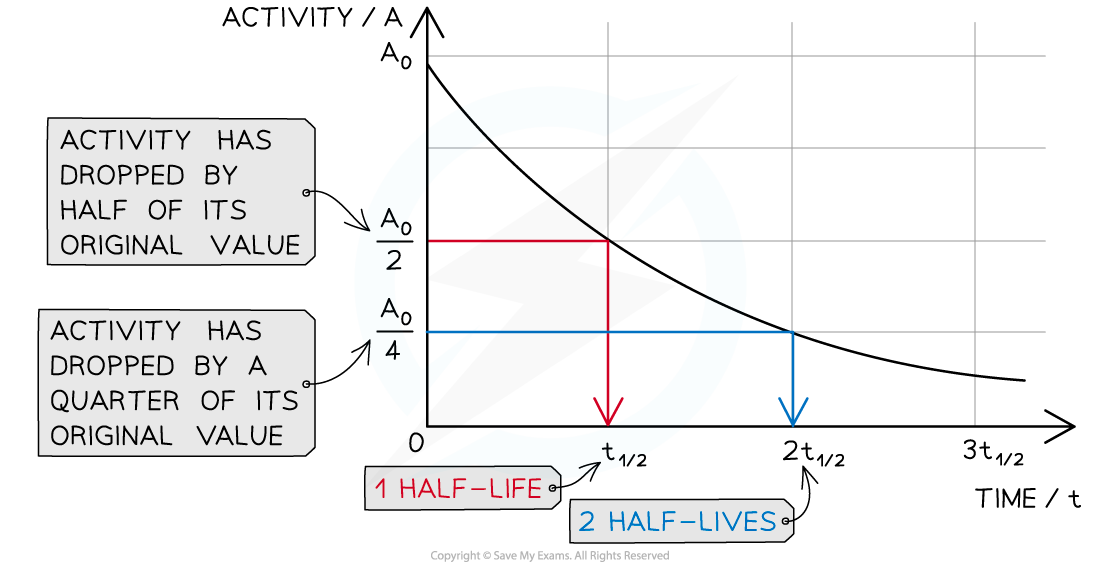
When a time equal to the half-life passes, the activity falls by half, when two half-lives pass, the activity falls by another half (which is a quarter of the initial value)
- To find an expression for half-life, start with the equation for?exponential decay:
N?=?N0?e–λt
- Where:
- N?= number of nuclei remaining in a sample
- N0?= the initial number of undecayed nuclei (when t = 0)
- λ = decay constant (s-1)
- t?= time interval (s)
- When time?t?is equal to the half-life?t?, the activity?N?of the sample will be half of its original value, so?N?= ??N0

- The formula can then be derived as follows:



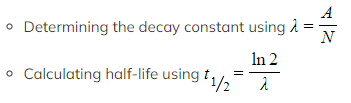
- Therefore, half-life?t??can be calculated using the equation:

- This equation shows that half-life?t??and the radioactive decay rate constant λ are inversely proportional
- Therefore, the?shorter?the half-life, the?larger?the decay constant and the?faster?the decay
- The half-life of a radioactive substance can be determined from decay curves and log graphs
- Since half-life is the?time taken for the initial number of nuclei, or activity, to reduce by half, it can be found by
- Drawing a line to the curve at the point where the activity has dropped to half of its original value
- Drawing a line from the curve to the time axis, this is the half-life
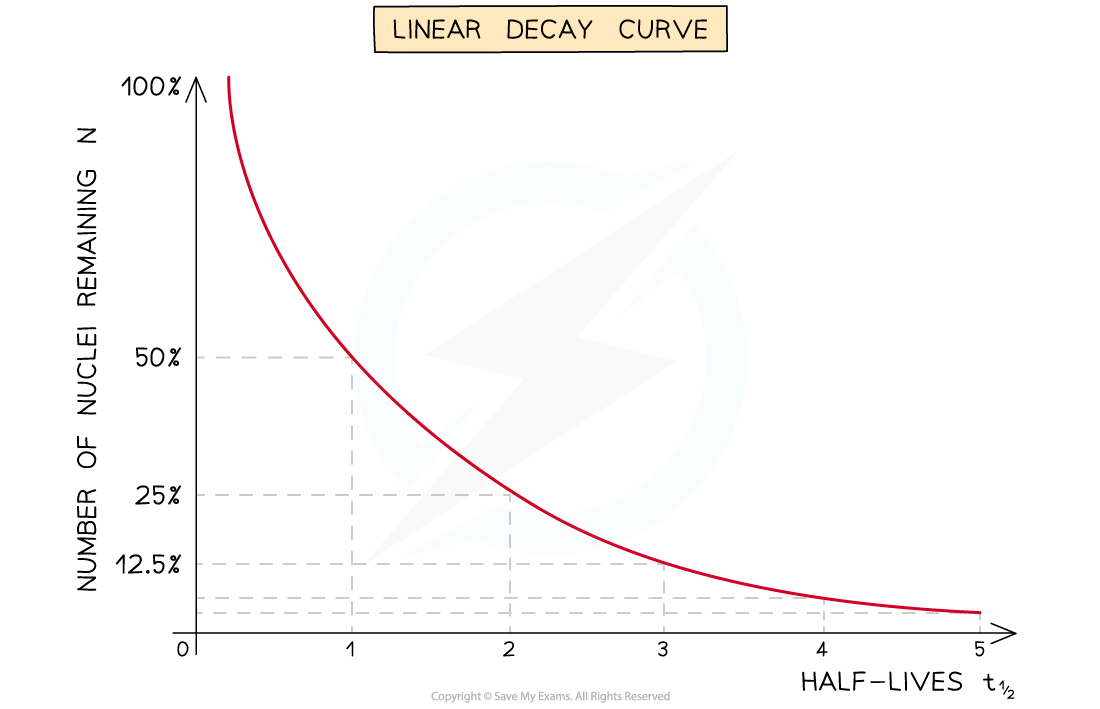
 Measuring Long Half-Lives
- For nuclides with long half-lives, on the scale of years, this can be measured by:
- Measuring the mass of the nuclide in a pure sample
- Determining the number of atoms?N?in the sample using?N?=?nNA
- Measuring the total activity?A?of the sample using the counts collected by a detector
 Note: The sample must be sufficiently large enough in order for a significant number of decays to occur per unit time so that an accurate measure of activity can be made
Measuring Short Half-Lives
- For nuclides with short half-lives, on the scale of seconds, hours or days, this can be measured by:
- Measuring the background count rate in the laboratory (to subtract from each reading)
- Taking readings of the count rate against time until the value equals that of the background count rate (i.e. until all of the sample has decayed)
- Plotting a graph of activity,?A, against time,?t?(as corrected count rate ∝ activity,?A)
- Making at least 3 estimates of half-life from the graph and taking a mean
OR
-
- Plotting a graph of ln?N?against time,?t?(as corrected count rate ∝ number of nuclei in the sample,?N)
- Finding the gradient of this graph, which gives –λ
 Straight-line graphs tend to be more useful than curves for interpreting data
-
- Due to the exponential nature of radioactive decay logarithms can be used to achieve a straight line graph
- Take the exponential decay equation for the number of nuclei
N?=?N0?e–λt
- Taking the natural logs of both sides
ln?N?= ln (N0) ? λt
- In this form, this equation can be compared to the equation of a straight line
y?=?mx?+?c
- Where:
- ln (N) is plotted on the y-axis
- t?is plotted on the x-axis
- gradient = ?λ
- y-intercept = ln (N0)
- Half-lives can be found in a similar way to the decay curve but the intervals will be regular as shown below:
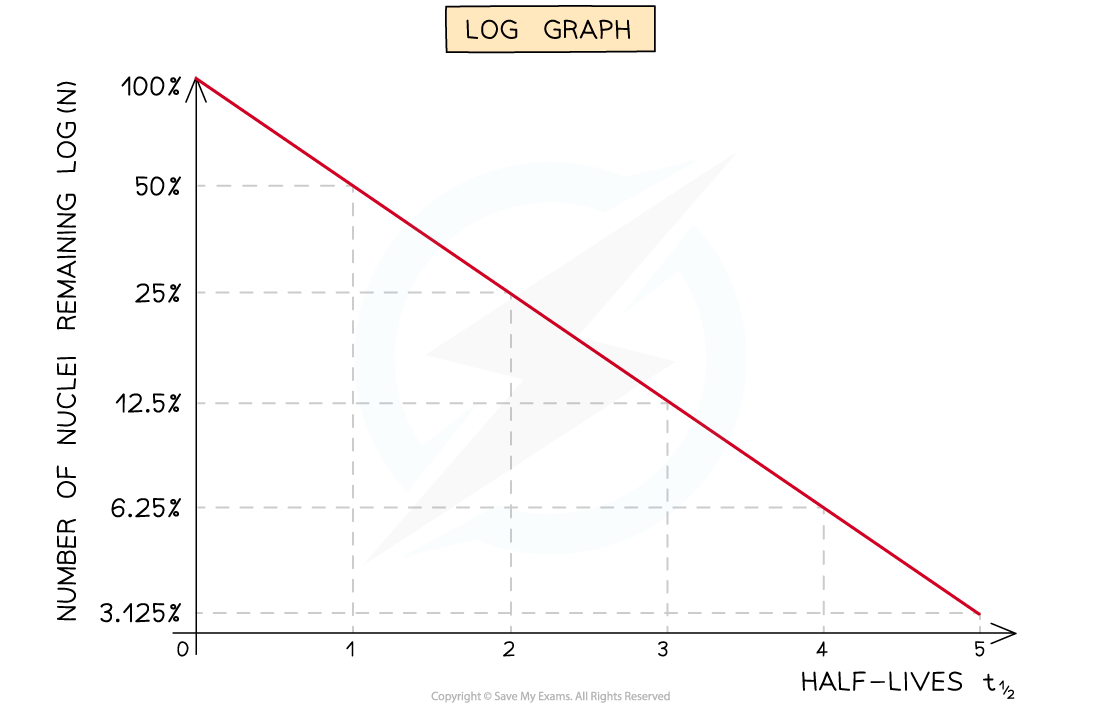
A logarithmic graph. This represents the relationship:?