IB DP Biology: SL復習筆記4.1.9 Skills: Pyramids of Energy

Pyramids of Energy
- Pyramids of energy illustrate the?amount of energy contained?within the?biomass?of organisms at each trophic level
- The?length?of each box, or bar, represents the quantity of energy present
- Pyramids of energy?should be drawn?to scale?so that each bar is?proportional?in size to the amount of energy that it represents
- In some situations, however, a pyramid of energy may be an approximate sketch where each bar is a rough representation of the energy contained
- These pyramids are always?widest at the base?and decrease in size as they go up
- The base is wide due to the large amount of energy contained within the biomass of producers
- Pyramids of energy show a?stepped?decrease?in the energy contained at each level of the food chain rather than appearing as pyramid with smooth sides
- The levels of a pyramid of energy should be labelled?producer,?first consumer,?second consumer, and so on
- The units used should be the amount of?energy, per unit area, per year?e.g. kJ m-2?year-1
- As you move up the pyramid to higher trophic levels, the quantity of energy decreases as?not all energy is transferred?to the biomass of the next trophic level (roughly 10 % of the energy is passed on)
- Energy is lost at each trophic level due to
- Incomplete consumption
- Incomplete digestion
- Loss of heat energy to the environment during respiration
- Excretion of the waste products of metabolism e.g. carbon dioxide, water, and urea
- As a result of this, the biomass at each trophic level will also decrease as energy availability decreases
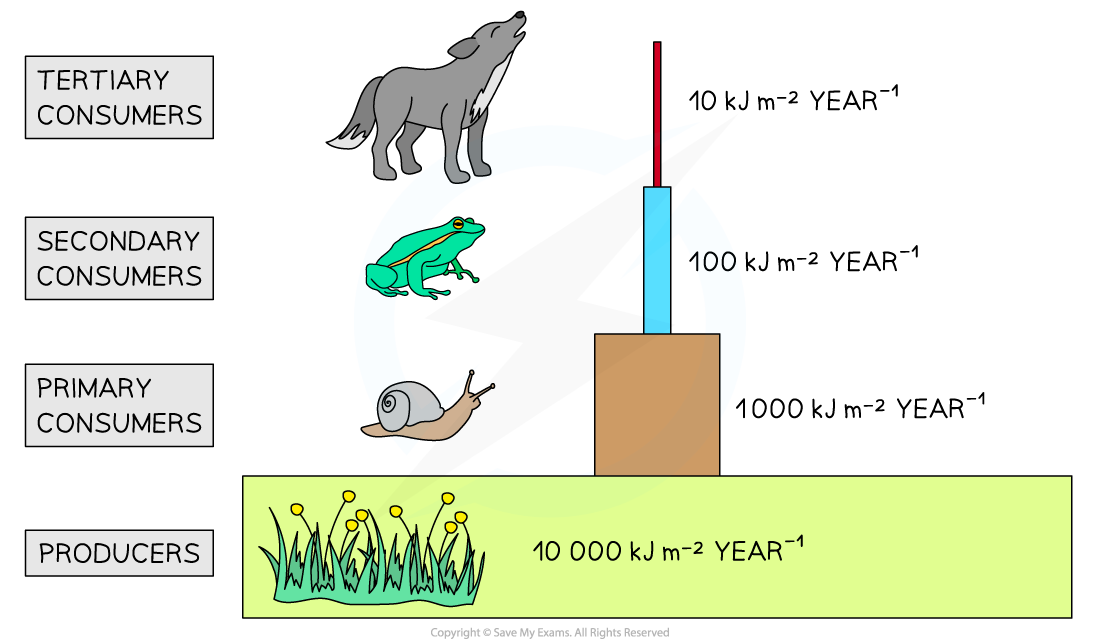
The energy stored in the biomass of organisms can be represented by a pyramid of energy
Exam Tip
Remember that pyramids of energy should be drawn to scale and the units used should be the amount of energy, per unit area, per year e.g. kJ m-2?year-1
轉載自savemyexams
以上就是關于【IB DP Biology: SL復習筆記4.1.9 Skills: Pyramids of Energy】的解答,如需了解學校/賽事/課程動態,可至翰林教育官網獲取更多信息。
往期文章閱讀推薦:
MIT官方發布【2026年夏季推薦閱讀書單】!橫跨科學/人文/經濟...


翰林AMC8視頻課重磅上線!

國際競賽真題資源免費領取


