IB DP Biology: SL復(fù)習(xí)筆記6.4.3 Lung Diseases

Cancer
NOS: Obtain evidence for theories: epidemiological studies have contributed to our understanding of the causes of lung cancer
- Theories?are developed based on?evidence?collected through observation and where possible, scientific investigations
- Obtaining?valid?and?reliable?evidence for theories on causes and consequences of different diseases can be difficult for several reasons.
- The sensitive nature of the data required
- Difficulty finding volunteers with the correct specific diagnoses
- The effect of?confounding factors
- Epidemiology?is the study of disease which includes monitoring the numbers and distribution of cases that arise, as well as building a bigger picture of the potential causes of the disease
- Epidemiological studies?are carried out on?large numbers?of patient volunteers to give an unbiased and reliable collection of data which make it possible to draw links between certain factors and the development of a disease
Causation and correlation
- It is very tricky to show that one particular factor is responsible for?causing?a disease, such as lung cancer, instead, data is usually used to show a?correlation?between a certain risk factor and the incidence of a disease
- Confounding factors?which share a similar correlation and also imply causation of the disease can make it difficult to establish the actual determinant
- Therefore it is necessary to study?several factors?simultaneously to collect enough data to carry out?statistical analysis?and develop the overall picture
- Risk factors?contribute towards the likelihood of developing a disease
- Therefore risk factors that are more easily controlled and measured in isolation are more likely to have a proven causal relationship, as they can be investigated in a more scientific manner
- For example, an individual’s exposure to smoking is much easier to quantify than their exposure to air pollution
- When analysing data and studies it is always important to remember that?risk factors interact with each other
- For example, a smoker with asthma is likely to suffer the associated negative health side effects more quickly than a smoker without asthma
- It is always important to remember that even though there is a correlation, this?does not mean?that there is a direct causal link
- For example, in places with higher pollution, there may be more asthmatic individuals but this does not mean that pollution caused asthma as there are many other variables at play
Causes of lung cancer
- Of all the cancers, lung cancer is the most commonly diagnosed and results in the most deaths globally
- Cancer occurs if?mutations?affect the regulation of mitosis in cells
- This causes uncontrolled mitosis which develops into?a mass of cells?in the?lumen?of the airways
- The tumour becomes larger because it has no method of programmed cell death and survives because it develops its own blood supply (vascularisation)
- The tumour then starts to interfere with the normal working of the lungs, such as by squeezing against blood vessels or cancer cells entering into the?lymphatic system, where they may develop another tumour
- A?causal?relationship has been?proven?for some risk factors relating to lung cancer
- Smoking?is a key contributor
- Tobacco?in cigarette smoke has been shown to have mutagenic effects on body cells due to chemicals found in the smoke
- The effects of these?mutagenic chemicals?can lead to cancer in smokers as well as the passive smokers inhaling their second hand smoke
- Inhalation of?air pollution?similarly, can result in lung cancer
- In cities, average rates of lung cancer diagnoses are much higher due to high levels of vehicle exhaust fumes and smoke from burning organic matter
- Radon gas?is a radioactive gas which can contribute to the numbers of lung cancer in some areas more than others
- Radon is released from rocks and buildings made from rocks containing high levels of radon gas
- Various building materials, such as?asbestos?and?silica, produce small dust particles which can cause lung cancer if they are inhaled
- There are strict rules about using or working with materials, such as asbestos and silica, to minimise exposure and therefore the associated risks
- Smoking?is a key contributor
Consequences of lung cancer
- There are many symptoms associated with a lung cancer diagnosis, including:
- Breathing difficulties
- Coughing, sometimes coughing up blood
- Chest pains
- Loss of appetite and weight loss
- Persistent fatigue
- Tumours can form in the lungs
- In severe cases, the?primary tumours metastasise?and lead to the formation of?secondary tumours?elsewhere in the body
- Survival rates from lung cancer are very low compared to other cancer types
- Only 15% of patients will survive more than 5 years
- Patients that do survive may suffer from?long term symptoms?such as:
- Pain
- Breathing difficulties
- Fatigue
- Anxieties associated with a cancer diagnosis and future prognosis
- Treatments?for lung cancer include:
- Chemotherapy
- Radiotherapy
- Lung removal
Exam Tip
Scatter?diagrams?are used to identify?correlations?between two variables to determine the relationships between two factors. For example, between risk factors and certain disease.Correlation can be?positive or negative
- Positive correlation: as variable A increases, variable B increases
- Negative correlation: as variable A increases, variable B decreases
- If there is?no correlation?between variables the?correlation coefficient will be 0
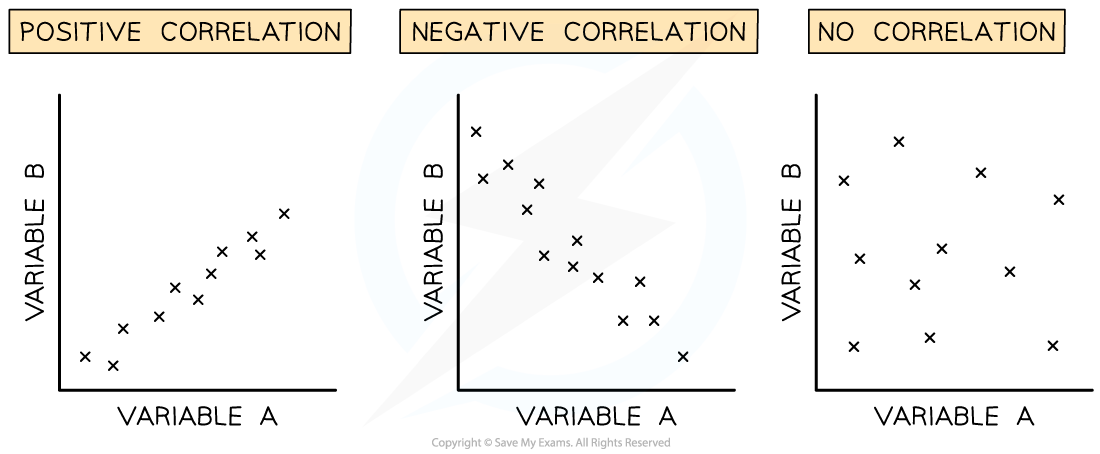 Image showing different types of correlation in scatter graphs
- There is a clear distinction between correlation and causation:?a correlation does not necessarily imply a causative relationship
- Correlation?is an association or relationship between variables
- Causation?occurs when one variable has an influence or is influenced by another
Emphysema
Causes of emphysema
- Emphysema?is an example of a?Chronic obstructive pulmonary disease?(COPD) which also includes lung diseases such as asthma and chronic bronchitis
- In a healthy lung,?some phagocytes?are present as part of the?non-specific?immune response to protect against bacteria found in the lungs
- Phagocytes produce the protein digesting enzyme,?elastase?to destroy?bacteria
- Elastase also breaks down proteins in the cells of the lungs, including?elastin
- An enzyme inhibitor,?alpha 1-antitrypsin (A1AT), is produced by lung cells to prevent damage caused by elastase
- In?smokers, goblet cells in the ciliated epithelium become enlarged and produce more mucus which?destroys the?cilia?in the trachea and
- This prevents cilia from sweeping mucus, containing?bacteria, dust and other microorganisms?away from the lungs, this leads to infections in the lungs
- Infections attract more?phagocytes?to the lungs and the phagocytes release?elastase
- A1AT is not effective against the increased levels of elastase and so the enzyme damages the elasticity of the?alveolar walls
- Without enough elastin, the alveoli?break down?and may burst, creating large air spaces in the alveoli with an insufficient?surface area to volume ratio
- Thickening?of the alveolar walls increases the?diffusion distance?for gas exchange
- This reduces the efficiency of gas exchange, causing?emphysema?where less oxygen is carried in blood (making exercise difficult)
- Once the disease progresses, people often need a constant supply of oxygen to stay alive
Consequences of emphysema
- Damage to the alveoli which result in emphysema, is?irreversible
- It leads to?low blood oxygen?levels and?high carbon dioxide?levels in patients
- The resultant?symptoms?include
- Shortness of breath or laboured ventilation
- A chronic or persistent cough
- Chest tightness
- Wheezing and difficulty breathing when exercising or during any physical activity
- Lack of energy
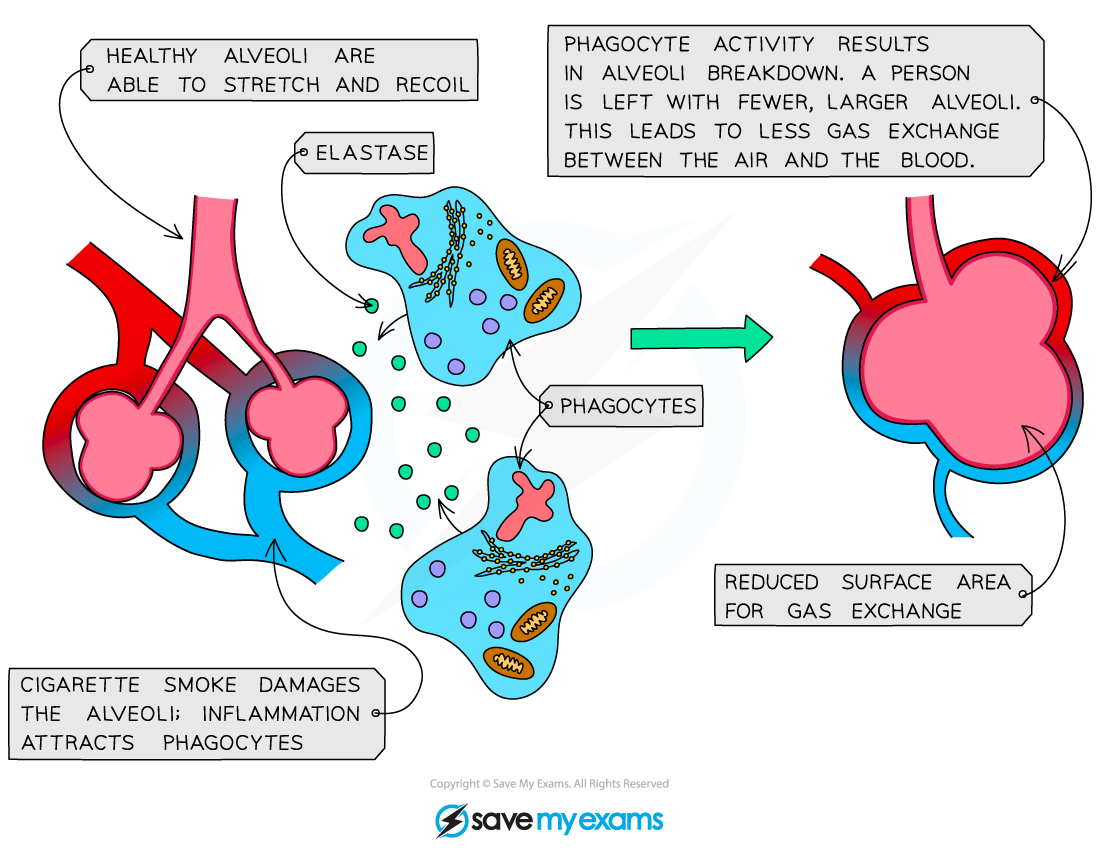
Emphysema can lead to a reduced number of alveolar air sacs with thicker walls
轉(zhuǎn)載自savemyexams
以上就是關(guān)于【IB DP Biology: SL復(fù)習(xí)筆記6.4.3 Lung Diseases】的解答,如需了解學(xué)校/賽事/課程動(dòng)態(tài),可至翰林教育官網(wǎng)獲取更多信息。
往期文章閱讀推薦:
斯坦福大學(xué)官方推薦書(shū)單!名校學(xué)霸們暑假都在讀什么?
MIT官方發(fā)布【2026年夏季推薦閱讀書(shū)單】!橫跨科學(xué)/人文/經(jīng)濟(jì)...


翰林AMC8視頻課重磅上線!

國(guó)際競(jìng)賽真題資源免費(fèi)領(lǐng)取






