IB DP Physics: SL復習筆記7.1.9 Investigating Half-Life

Investigating Half-Life
Aim of the Experiment
- The aim of the experiment is to investigate the half-life of a decaying radioactive sample
- This can be done with a live sample if safe access is available
- This can also be done through an online simulation
Variables
- Independent variable?= time,?t
- Dependent variable?= radioactive activity,?A
- Control variables:
- Size of sample
- Same distance from detector to sample
- Same material for sample
Equipment List
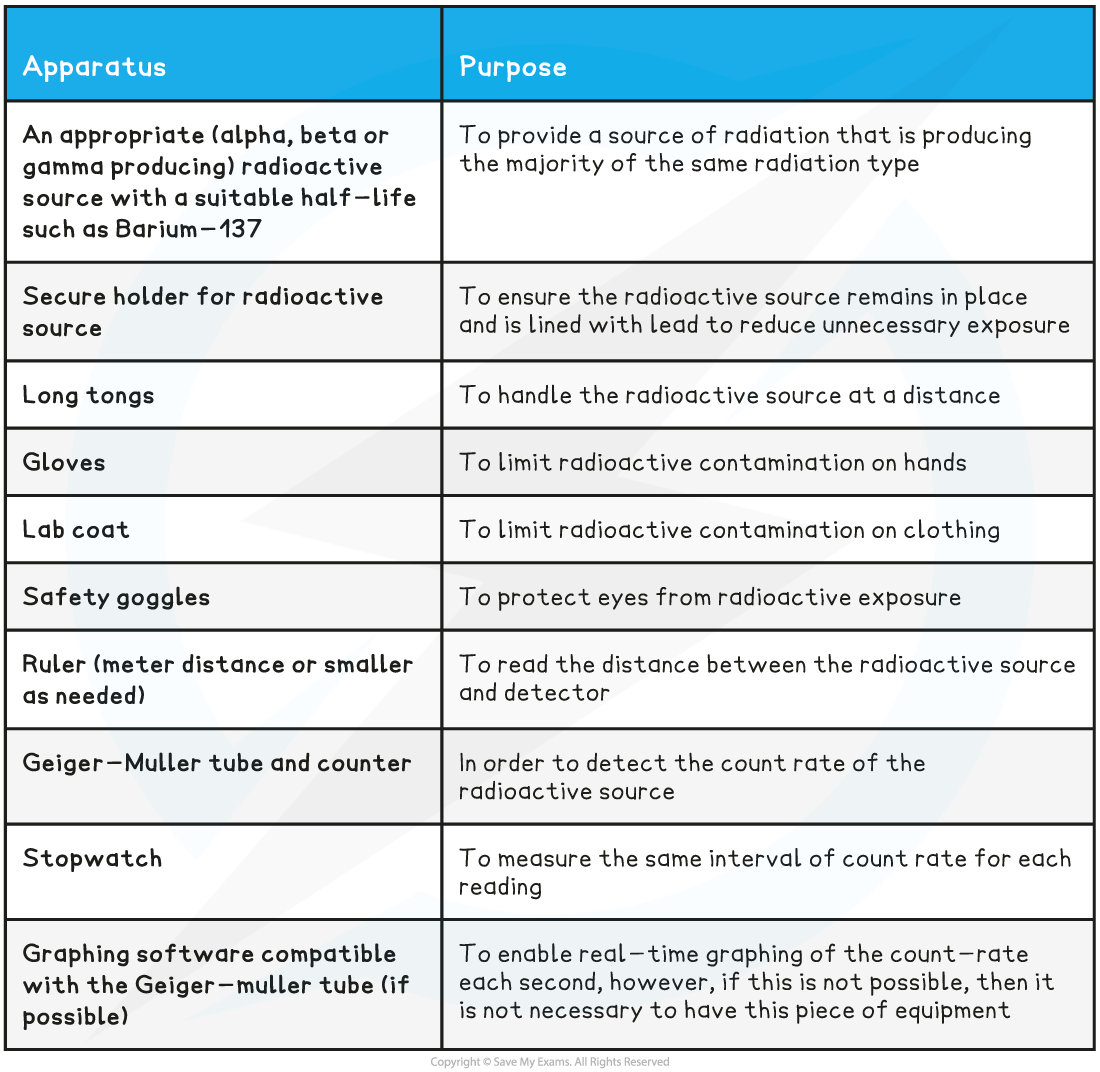
- Resolution?of equipment:
- Metre ruler = 1 mm
- Stopwatch = 0.01 s
Method
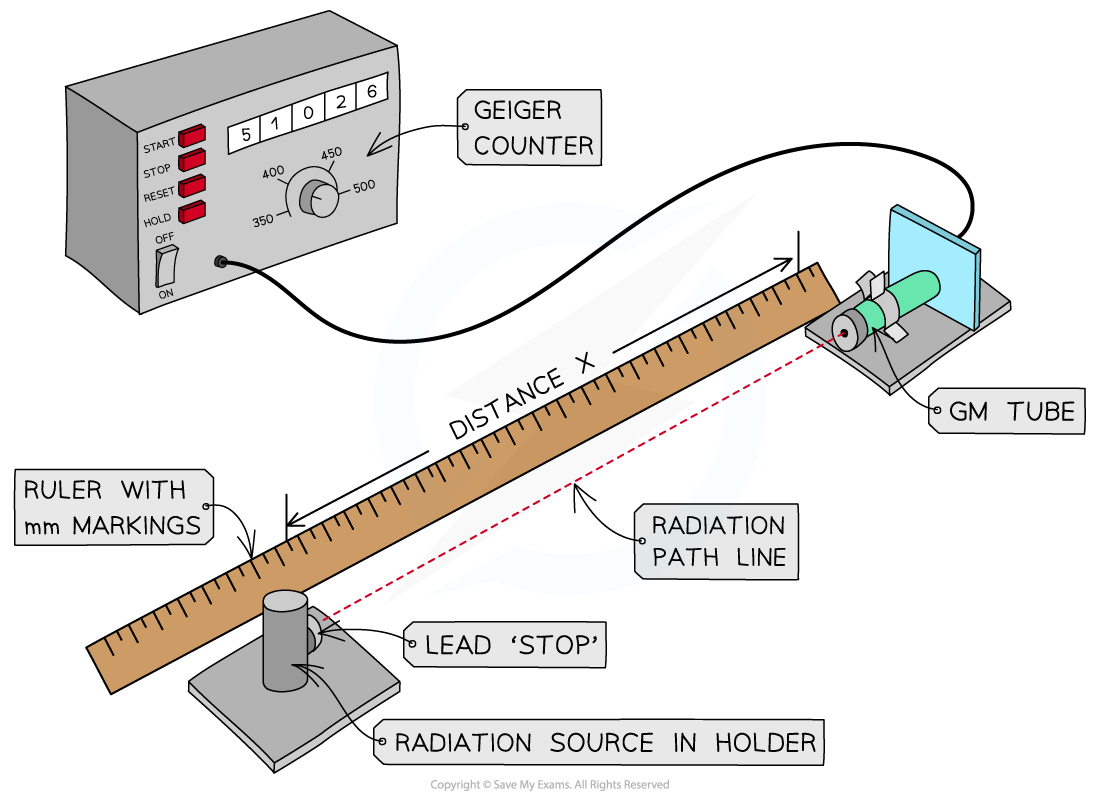
- Measure the background radiation for 30 second intervals using a Geiger-Muller tube without the radiation source in the room, take several readings and find an average
- Next, put the radiation source at a set starting distance appropriate for the ionizing strength of the radiation (e.g. 1 - 2 cm for an alpha source, 2 - 5 cm for a beta source and 15 - 30 cm for a gamma source) from the GM tube
- If graphing software is available to use with the Geiger-Muller tube, then that should be started as soon as the source is placed in position, if not, then proceed to step 4
- Once the sample is in place measure the number of counts in 30-second intervals for 10 minutes or until the activity greatly decreases from the beginning value
- Remove sample and replace into a lead-lined box or safe storage container
- Repeat this for several trials if possible using fresh same size samples
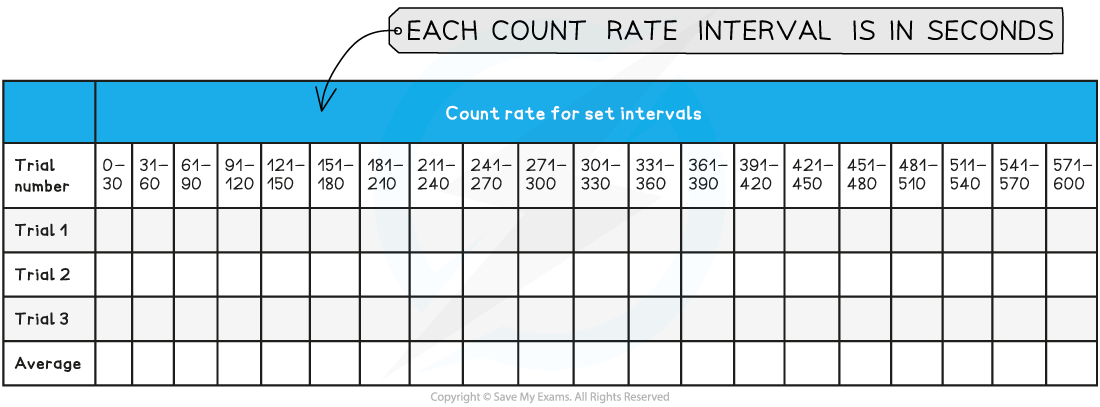
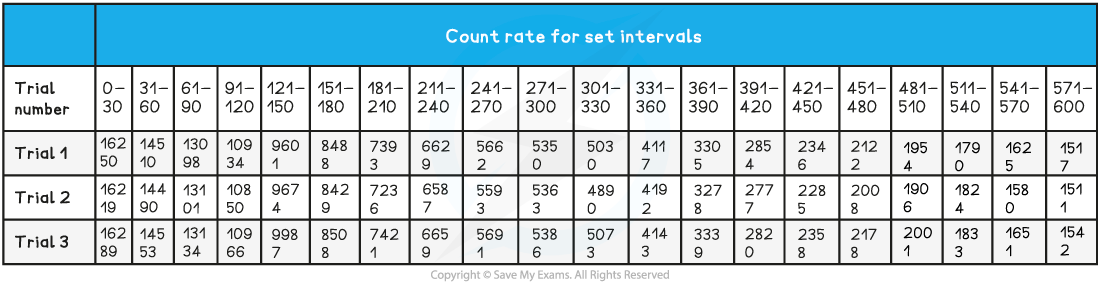
A suitable table of results might look like this:
Analysis of Results
- What is important for this experiment is the initial count rate and the following decrease as the radioactive source decays from the?parent nuclei?into the?daughter nuclei.
- The background rate?must be subtracted?from the data before analysis can begin. This is true for both graphed and manual data
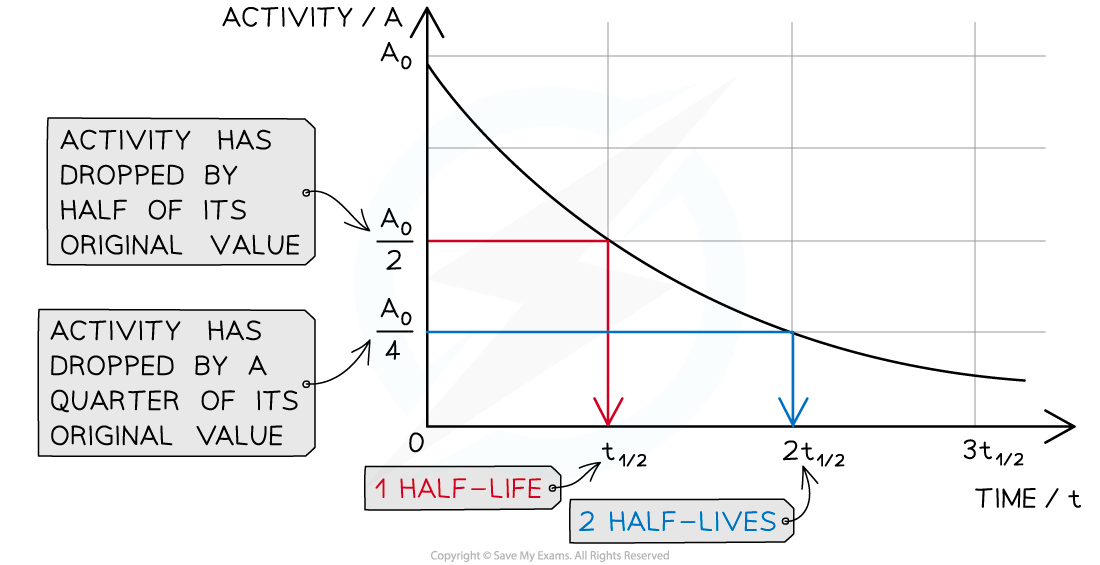
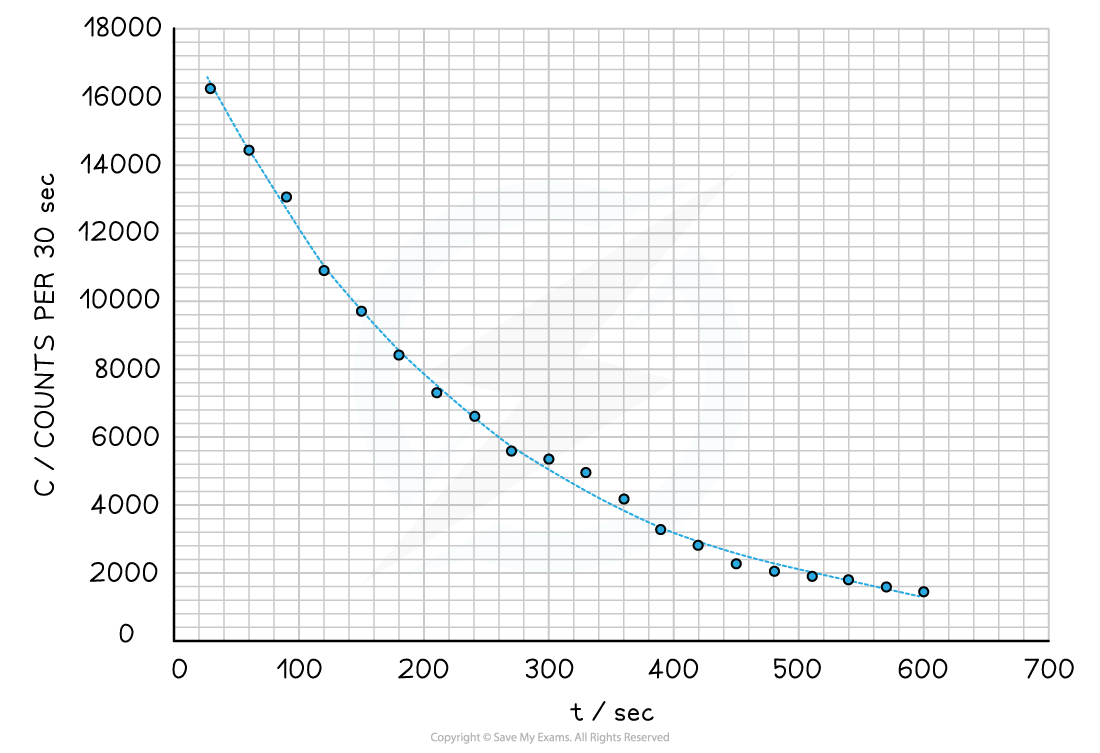
- In order to see the decrease and model it, the data should be graphed with the correct count rate (background subtracted) on the y-axis and the time intervals on the x-axis. If graphing software is used then the graph should look similar to the following:

- However, if the manual method is used, then there will be twenty data points rather than a smooth curve with fluctuations
- Using this curve, the half-life can be found by comparing the initial magnitude of the activity with the time it takes to decay to half of the original activity.
- This can be extended by finding the time taken for two half-lives to pass and the activity to reach one quarter for quantitative comparison
- Compare found half-life for the radioactive sample with the known value
Evaluation
Systematic errors:
- The Geiger counter may suffer from an issue called “dead time”
- This is when multiple counts happen simultaneously within ~100 μs and the counter only registers one
- This is a more common problem in older detectors, so using a more modern Geiger counter should reduce this problem
- If this experiment is done manually, there will be uncertainty in the time
- This uncertainty in time intervals will mean variation in counting intervals, however, due to the 30-second interval and the nature of this experiment this is not easily accounted for
- It is best to discuss what these uncertainties could mean for the results of this experiment
Random?errors:
- Radioactive decay is?random, so repeat readings are vital in this experiment
- Measure the count over an appropriate time span such as 30 seconds
- A larger count helps reduce the statistical percentage uncertainty inherent in smaller readings
- This is because the percentage error is proportional to the inverse-square root of the count
- However, a shorter count will mean that more data points are available to help make an appropriate decay curve
Safety Considerations
- For any radioactive source:
- Reduce the exposure time by keeping it in a lead-lined box when not in use
- Handle with long tongs
- Avoid physical contact and handle the source with care
- Do not point the source at anyone and keep a large distance (as activity reduces by an inverse square law)
- Safety clothing such as a lab coat, gloves and goggles must be worn
Worked Example
A student measures the background radiation count in a laboratory and obtains the following readings:

The student is trying to verify the half-life of a sample of Barium-137. He collects the following data:?Use this data to determine the half-life of the radioactive samples.
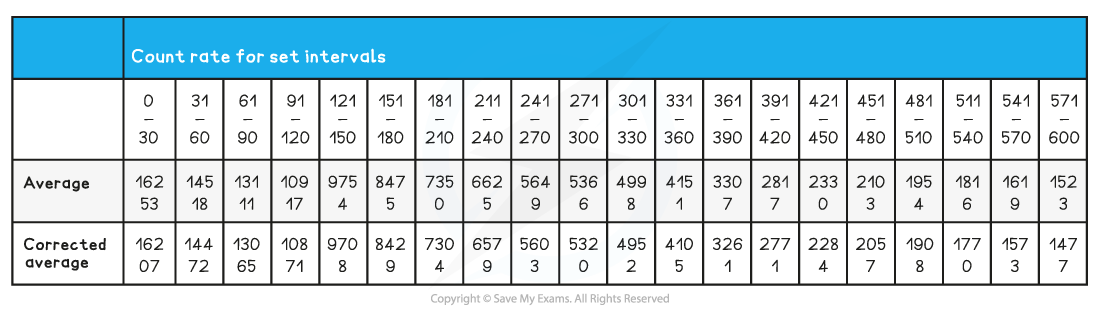
Step 1: Determine a mean value of background radiation

Step 2: Calculate C (corrected average count rate)
Step 3: Plot a graph of C against?t?(time in 30-sec intervals) and add a smooth-fitting curve
Step 4: Map the first three half-lives use the curve
-
- The first half-life took approximately 160 seconds to occur
- The second half-life took approximately 150 seconds to be reached following the first half-life
- The third half-life took approximately 155 seconds to be reached following the second half-life
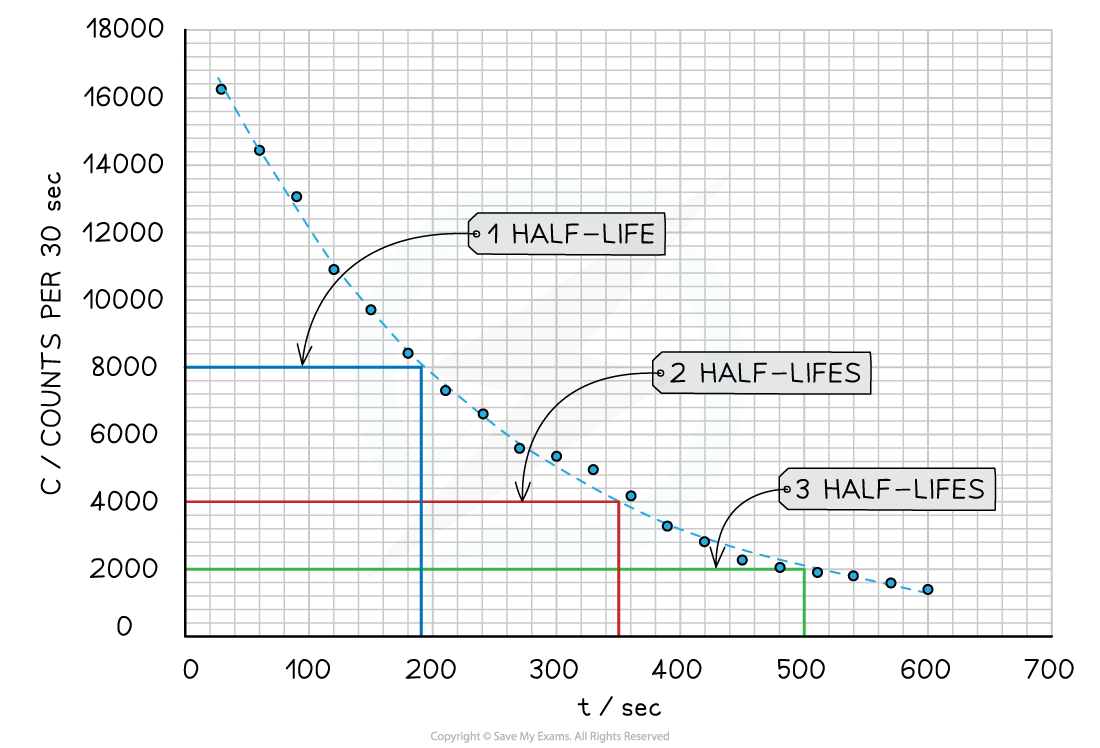
Step 5: Average the half-lives
(160 + 150 + 155) ÷ 3 = 155 seconds
Step 6: State the final answer
-
- The final found answer was?155 seconds?for the half-life of this sample data
轉載自savemyexams
以上就是關于【IB DP Physics: SL復習筆記7.1.9 Investigating Half-Life】的解答,如需了解學校/賽事/課程動態,可至翰林教育官網獲取更多信息。
往期文章閱讀推薦:
MIT官方發布【2026年夏季推薦閱讀書單】!橫跨科學/人文/經濟...


翰林AMC8視頻課重磅上線!

國際競賽真題資源免費領取


