Edexcel A Level Chemistry:復(fù)習(xí)筆記1.9.3 Maxwell-Boltzmann Distributions

Temperature Effects
Maxwell-Boltzmann distribution curve
- A?Maxwell-Boltzmann distribution curve?is a graph that shows the distribution of?energies?at a certain?temperature
- In a sample of a gas, a few particles will have very low energy, a few particles will have very high energy, but most particles will have energy in between
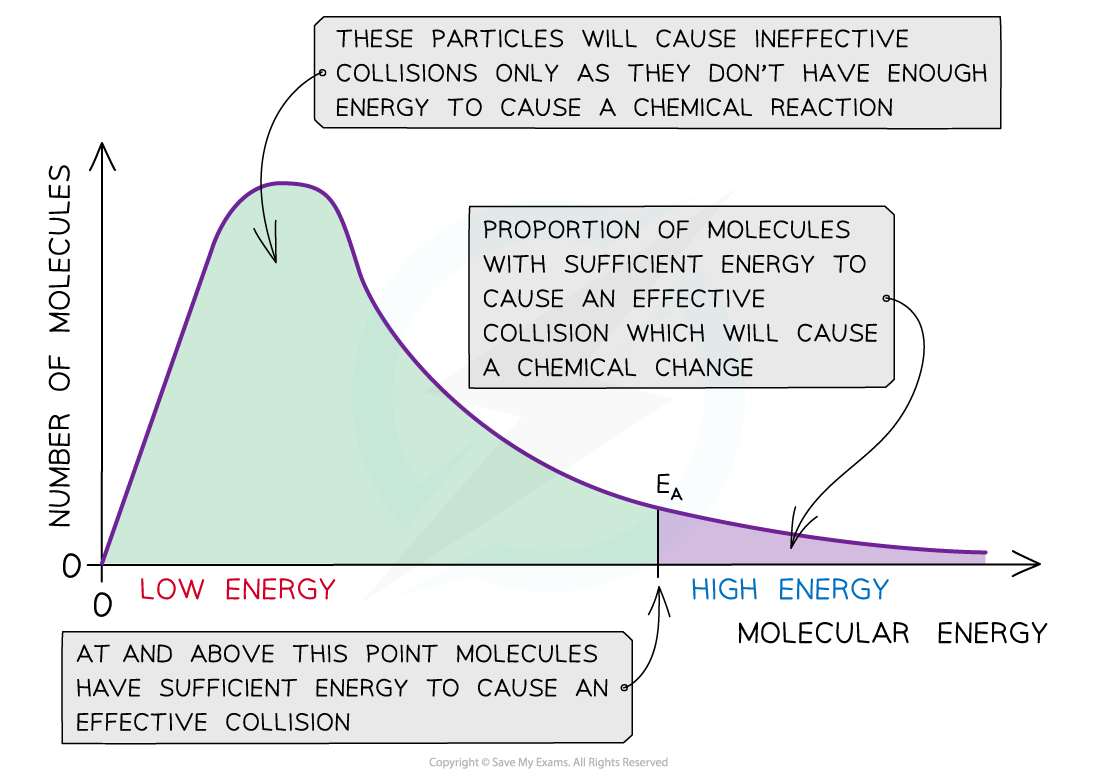
The Maxwell-Boltzmann distribution curve shows the distribution of the energies and the activation energy
- The graph shows that only a small proportion of molecules in the sample have enough energy for an?effective collision?and for a?chemical reaction?to take place
Changes in temperature
- When the temperature of a reaction mixture is increased, the particles gain more kinetic energy
- This causes the particles to move around faster resulting in more?frequent collisions
- Furthermore, the proportion of?successful collisions?increases, meaning a higher?proportion?of the particles possess the minimum amount of energy (activation energy) to cause a chemical reaction
- With higher temperatures, the Boltzmann distribution curve?flattens?and the peak?shifts?to the right
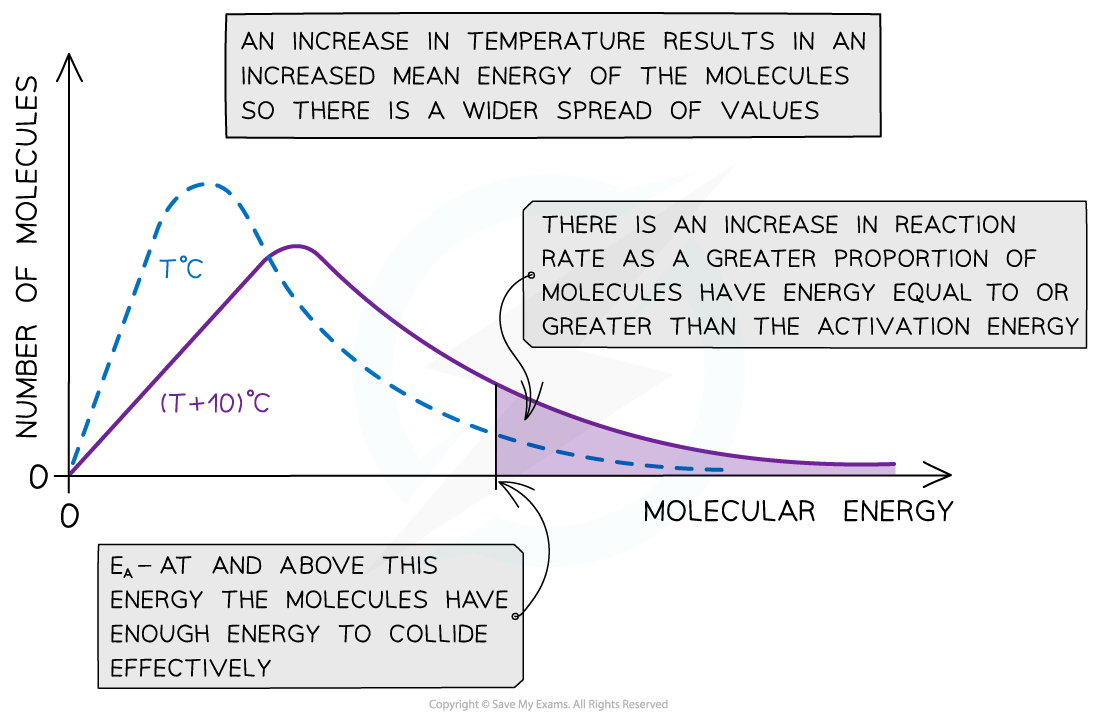
The Maxwell-Boltzmann distribution curve at T?oC and when the temperature is increased by 10?oC
- Therefore, an increase in temperature causes an increased rate of reaction due to:
- There being?more effective collisions?as the particles have?more kinetic energy, making them move around faster
- A?greater proportion?of the molecules having?kinetic energy?greater than the?activation energy
Exam Tip
The increase in proportion of molecules having kinetic energy greater than the activation has a greater effect on the rate of reaction than the increase in effective collisions
Effects of Adding a Catalyst
- Catalysis?is the process in which the rate of a chemical reaction is increased, by adding a?catalyst
- A catalyst increases the rate of a reaction by providing the reactants with an?alternative reaction pathway?which is?lower in activation energy?than the uncatalysed reaction
- Catalysts can be divided into two types:
- Homogeneous catalysts
- Heterogeneous catalysts
- Homogeneous?means that the catalyst is in the?same phase?as the reactants
- For example, the reactants and the catalysts are all in solution
- Heterogeneous?means that the catalyst is in a?different phase?to the reactants
- For example, the reactants are gases but the catalyst used is a solid
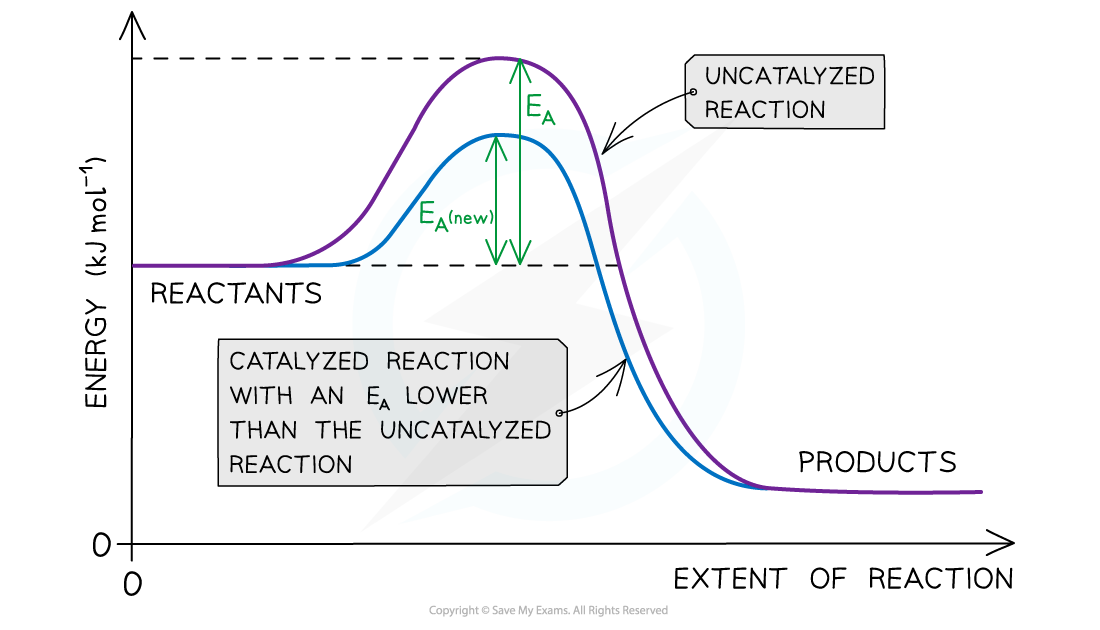
The diagram shows that the catalyst allows the reaction to take place through a different mechanism, which has a lower activation energy than the original reaction
Maxwell-Boltzmann distribution curve
- Catalysts?provide the reactants another pathway which has a lower activation energy
- On the graph below, the original number of successfully reacting particles is shown by the dark shaded area
- By lowering?Ea,?a?greater proportion?of molecules in the reaction mixture have the activation energy, and therefore have sufficient energy for an?effective collision
- This is shown by the combined number of particles in the light and dark shaded areas
- As a result of this, the rate of the catalysed reaction is increased compared to the uncatalysed reaction
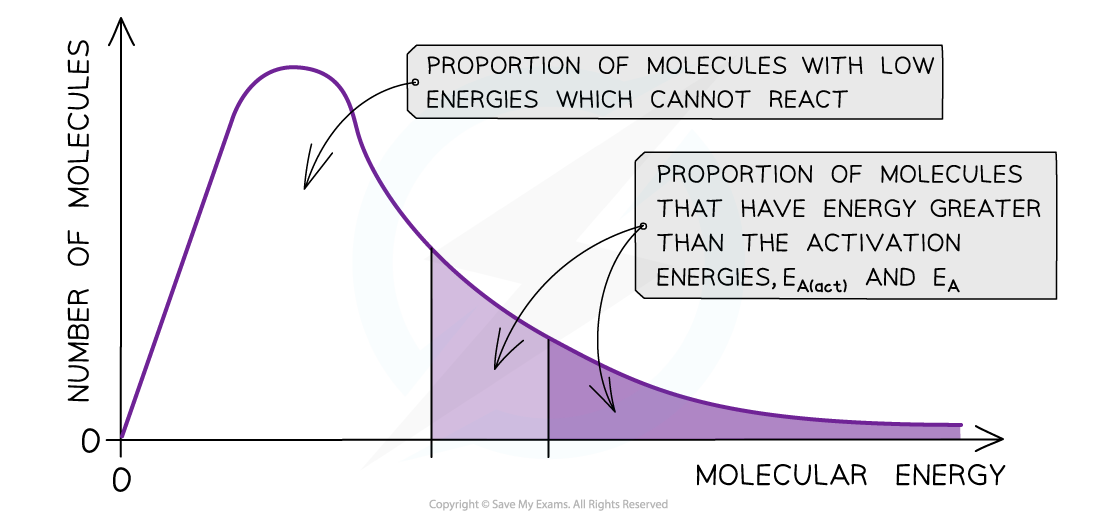
The diagram shows that the total shaded area (both dark and light shading) under the curve shows the number of particles with energy greater than the Ea?when a catalyst is present. This area is much larger than the dark shaded area which shows the number of particles with energy greater than the Ea?without a catalyst
轉(zhuǎn)載自savemyexams
以上就是關(guān)于【Edexcel A Level Chemistry:復(fù)習(xí)筆記1.9.3 Maxwell-Boltzmann Distributions】的解答,如需了解學(xué)校/賽事/課程動態(tài),可至翰林教育官網(wǎng)獲取更多信息。
往期文章閱讀推薦:
斯坦福大學(xué)官方推薦書單!名校學(xué)霸們暑假都在讀什么?
MIT官方發(fā)布【2026年夏季推薦閱讀書單】!橫跨科學(xué)/人文/經(jīng)濟(jì)...


翰林AMC8視頻課重磅上線!

國際競賽真題資源免費領(lǐng)取






