Edexcel A Level Economics A:復習筆記1.2.9 Indirect Taxes and Subsidies

Indirect Taxes
- An?indirect tax?is paid on the consumption of goods/services
- It is only paid if consumers make a?purchase
- It is usually levied by the government on?demerit goods?to reduce the quantity demanded (QD) and/or to raise?government revenue
- Government revenue?is used to fund?government provision of goods/services?e.g education
- Indirect taxes can occur as a?specific?or?ad valorem?tax
- They are levied by the government on?producers.?This?is why the supply curve shifts
- Producers and consumers?each pay a share (incidence) of the tax
The Incidence of a Specific Tax
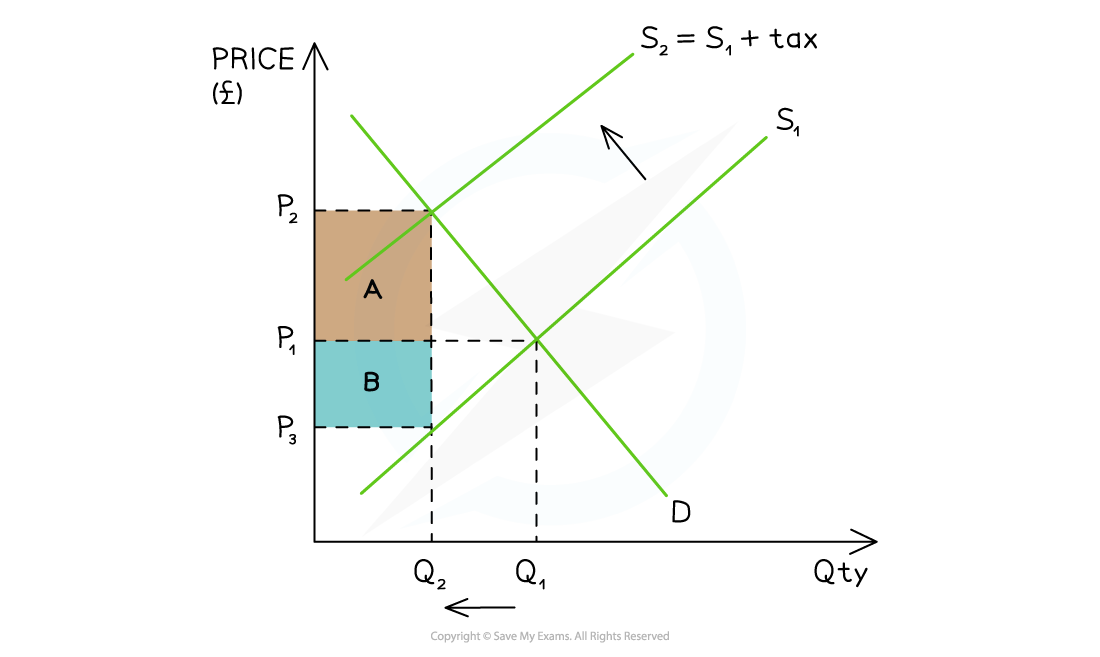
A diagram that demonstrates the share of a specific tax paid by the consumer (A)
and the producer (B)
Diagram Analysis
- The government places a?specific tax?on a?demerit good
- The supply curve shifts left from S1→S2?by the amount of the tax
- The?price the consumer pays has increased?from P1?before the tax, to P2?after the tax
- The?price the producer receives has decreased?from P1?before the tax to P3?after the tax
- The?government receives tax revenue?= (P2-P3) x Q2
- The?consumer incidence?(share) of the tax is equal to?area A - (P2-P1) x Q2
- The?producer incidence?(share) of the tax is equal to?area B - (P1-P3) x Q2
- The?QD?in this market has?decreased?from Q1→Q2
- If the?decrease in QD?is significant enough, it may force producers to?lay off some workers
Exam Tip
When drawing this diagram, students often find it hard to?identify the three price points.
The tax incidence boxes are formed by drawing the?new equilibrium quantity?through the?original supply curve. The three price points are the?old?equilibrium point,?new equilibrium point?- and where the?new quantity crosses the original supply curve.
Irrespective if you are dealing with taxes or subsidies, always use the new equilibrium point to determine your incidence boxes.
The consumer incidence is paid from the?consumer surplus?area and the producer incidence is paid from the?producer surplus?area.
A Side by Side Comparison of The Impact of PED on Tax Incidence
- Aiming to maximise their profits,?producers?pass on?as much of the indirect tax as they can to?consumers?and pay the balance themselves
- The amount?passed on?to consumers depends on the?price elasticity of demand (PED)?of the product
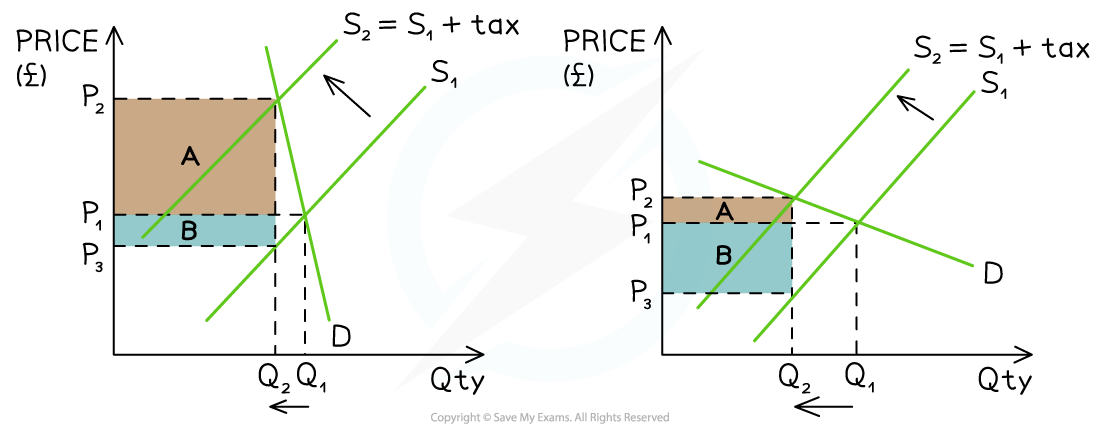
A diagram that demonstrates the tax incidence for a product whose PED is inelastic (left) and elastic (right). A is the consumer incidence and B is the producer incidence
Diagram Analysis
- In both diagrams, the?specific tax?shifts the?supply curve?from S1→S2
- There is a?higher market price?at P2?and?lower QD?at Q2
- Tax revenue?for the government is the sum of?A+B
- Consumer incidence?is represented by A and?producer incidence?by B
- Total revenue?for the seller is calculated using?P3?X Q2
- The?difference in PED?results in a?different steepness?to the demand curve
- For an?inelastic product?(e.g., cigarettes), producers pass on a much?higher proportion of the tax to consumers?(A) and pay the rest themselves (B)
- The?QD decreases?(Q1→Q2) but by a much?smaller proportion?than the increase in?price?(P1→P2)
- For an?elastic product?(e.g., pizza), producers pass on a much?smaller proportion of the tax to consumers?(A) and pay the rest themselves (B)
- The?QD decreases?(Q1→Q2) but by a much?larger proportion?than the increase in?price?(P1→P2)
- For an?inelastic product?(e.g., cigarettes), producers pass on a much?higher proportion of the tax to consumers?(A) and pay the rest themselves (B)
Exam Tip
When asked to?evaluate?the impact of a tax in a particular market, it is essential to apply knowledge of PED to the impact it will have on producers, consumers and the government.
It should be obvious?from the context?if the product in the question is?elastic or inelastic in demand. If not, work through the?factors that determine PED?and make a?judgement?as to whether the product is?elastic or inelastic?in demand. In your answer, explain your reasoning.
Subsidies
- A?producer subsidy?is a?per unit?amount of money given to a firm by the government
- To?increase production
- To?increase provision?of a?merit good
- The?incidence?(share) of the?subsidy?is determined by the?PED of the product
- If governments subsidies goods/services with high PED,?the increase in QD?will be?more than proportional?to the?decrease in price
- Producers?keep some?of the subsidy and?pass the rest on?to the consumers
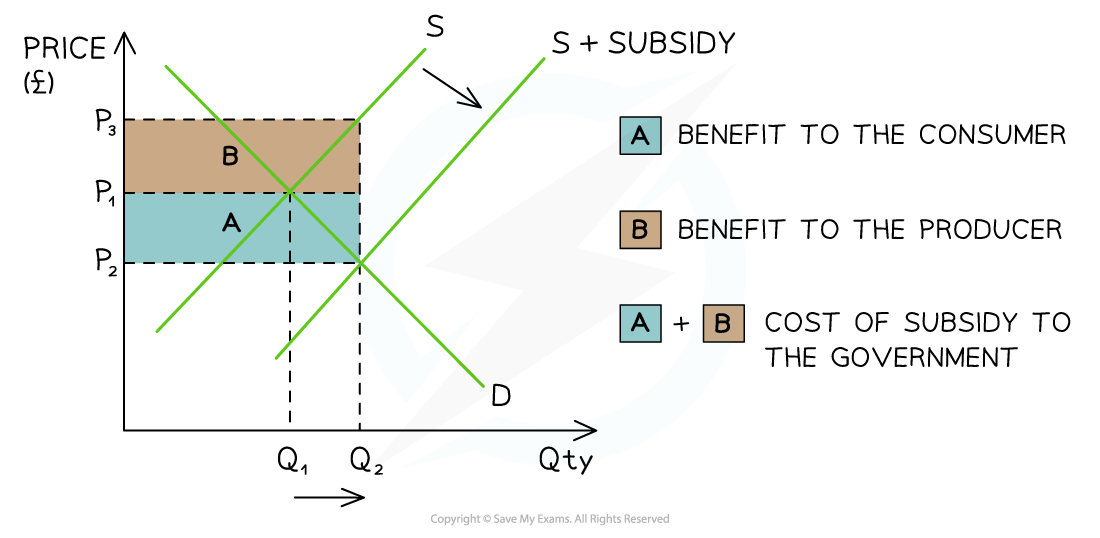
A diagram which demonstrates the cost of a subsidy to the government (A+B) and the incidence received by the?consumer (A) and producer (B)
Diagram Analysis
- The original?equilibrium?is at?P1Q1
- The?subsidy?shifts the supply curve from?S → S + subsidy:
- This?increases the QD?in the market from?Q1→Q2
- The?new?market?equilibrium?is P2Q2
- This is a?lower price?and?higher QD?in the market
- Producers receive?P2?from the consumer?PLUS?the subsidy per unit from the government
- Producer revenue is therefore?P3?x Q2
- Producer incidence?of the subsidy is marked B in the diagram
- The subsidy?decreases the price?that consumers pay from?P1?→ P2
- Consumer incidence?of the subsidy is marked A in the diagram
- The?total cost?to the government of the subsidy is?(P3?- P2) x Q2?represented by?area A+B
Exam Tip
Memorise the distinction below?as students get very confused when answering questions on subsidies.
When dealing with a?subsidy,?the?producer benefit is now the top portion of the incidence area and consumer incidence is below.?This can be confusing as in all other diagrams, it is the other way around (surplus, indirect tax etc.)
Logically, it makes sense. Producers are given an extra amount of money for each unit by the government so this raises the sales revenue they receive, while at the same time lowering the price consumers pay.
轉載自savemyexams
以上就是關于【Edexcel A Level Economics A:復習筆記1.2.9 Indirect Taxes and Subsidies】的解答,如需了解學校/賽事/課程動態,可至翰林教育官網獲取更多信息。
往期文章閱讀推薦:
MIT官方發布【2026年夏季推薦閱讀書單】!橫跨科學/人文/經濟...


翰林AMC8視頻課重磅上線!

國際競賽真題資源免費領取






