Edexcel A Level Maths: Statistics:復(fù)習(xí)筆記2.1.2 Frequency Tables

Frequency Tables
In most cases in your statistics course, you will come across data that is presented in a?frequency table. These allow data to be summarised and make them easier to work with.
Ungrouped Data
A frequency table for?ungrouped data?shows the frequency of?individual data values
Why use a frequency table for ungrouped data?
- When collecting large amounts of raw data, it is quicker to use a tally system and then collate the results into a frequency table
- Ungrouped frequency tables are normally used for?numerical, discrete data
- Organising data into a frequency table makes it easier to work with
- Calculating averages, ranges and summary statistics can be done much quicker from a frequency table than from raw data
- It gives a clear?pattern?of the data
- It is easy to quickly see where most of the data are and to see extreme values
- A frequency table for ungrouped data keeps all of the original data values
- It is still possible to calculate the actual averages, ranges and summary statistics
How are mean, median and mode calculated from an ungrouped frequency table?
- You should already be familiar with finding the mean, median and mode from raw, ungrouped data
- The?mode?is the value that occurs?most often?in a data set
- In an ungrouped frequency table the?data value?with the?highest frequency?will be the mode
- The?median?is the?middle?value when the data is in?order of size
- To find the median from an ungrouped frequency table, add the frequencies together until you reach the value that is half of the total
- For a data set of values, calculate
 ?and the median will be whichever data value corresponds with this frequency
- The?mean?is the?sum?of all the values?divided by the number of values?in the data set
- To find the mean, multiply each data value by its corresponding frequency, find the sum of these values and then divide by the total frequency
- The notation for the sum of the values is

- The formula for the mean from a frequency table is

Worked Example
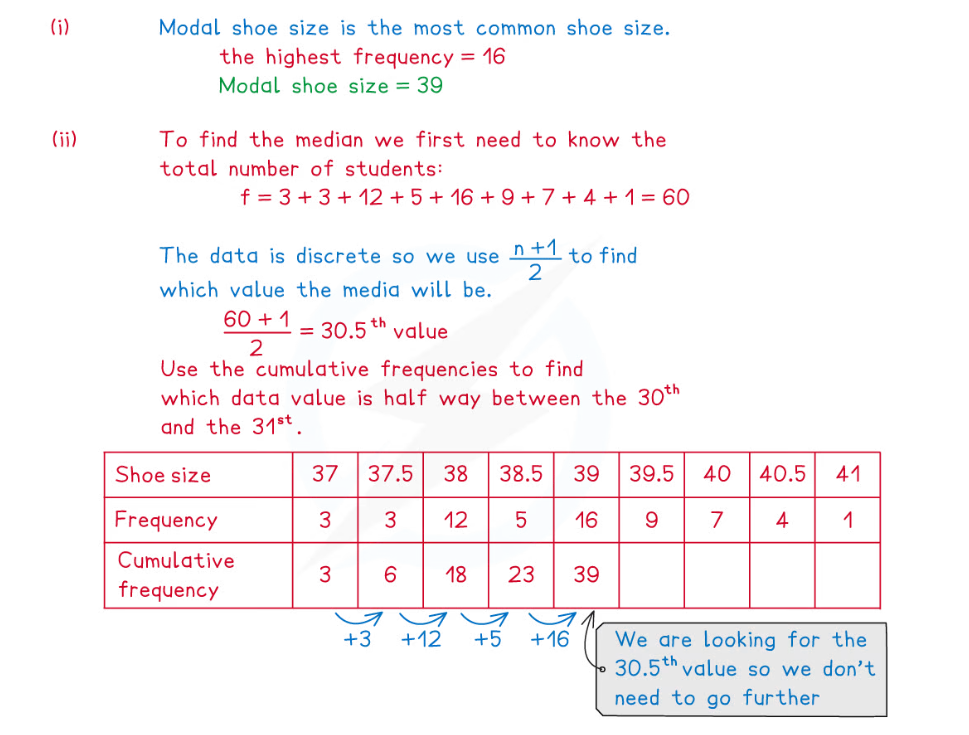
The frequency table below gives information about the shoe size of a group of year 12 students.
| Shoe Size | 37 | 37.5 | 38 | 38.5 | 39 | 39.5 | 40 | 40.5 | 41 |
| Frequency | 3 | 3 | 12 | 5 | 16 | 9 | 7 | 4 | 1 |

Exam Tip
- Use common sense when checking your answers, is your mean within the range of the data? Does is seem right? A mean of 140 for example could not be correct if the data is about ages of students taking an exam at university.
Grouped Data
A frequency table for?grouped data?is usually used for large amounts of?continuous data.?They shows the frequency of?data values?that are within a particular?group?or?class.
What are the advantages and disadvantages of grouping data?
- Grouping data is especially useful when data can take a large range of different values
- Trends and patterns can be easily spotted when data has been grouped
- Calculations are much quicker with data that has been grouped
- It is important to be aware, however, that grouped frequency tables also have some negatives
- The actual data values are lost when data is grouped
- It is only possible to calculate estimated averages, ranges and summary statistics
Notation for grouped frequency tables
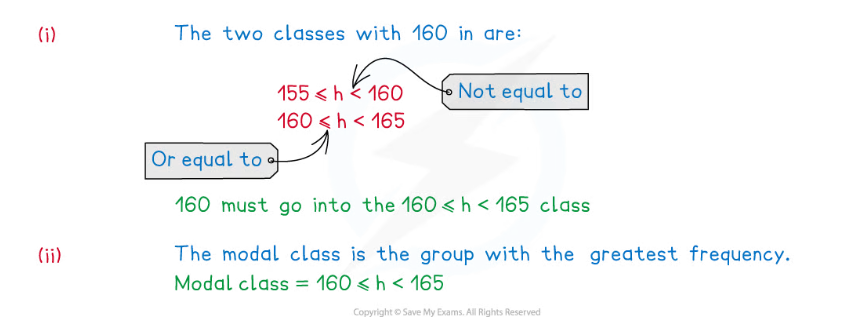
- When grouping data, it is important to be clear about which?group?or?class?any data value should be entered into
- A group entry of 10 – 20 followed by 20 – 30 would be unclear because the number 20 could be entered into both groups
- If the data are discrete, this could be written as 10 – 19 and 20 – 29
- For continuous data, this could be changed to 10 – and 20 –
- This would most likely be represented as
 and
and 
- A group entry of 10 – 20 followed by 20 – 30 would be unclear because the number 20 could be entered into both groups
- Most commonly inequalities are used to group continuous data as they leave no ambiguity
- If the data are continuous, always check that there are no gaps between upper boundary of a class and the lower boundary of the next class
- If there are gaps you will need to close these gaps by changing the boundaries before carrying out any calculations
- For example, the groups
 followed by
 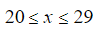 will become
 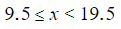 and
and 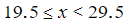
- Check the inequality signs carefully
- For example, the groups
- If there are gaps you will need to close these gaps by changing the boundaries before carrying out any calculations
- Be careful when deciding what category the data falls into, taking the group ?for example,
- if the data had been rounded it would take the form ?as described above
- if the data had been?truncated however, then the boundaries would become
- this is most likely to happen with age, which is technically a continuous variable due to being able to take any, however we would usually consider age by counting years
- if the data had been rounded it would take the form
Finding averages from grouped frequency tables
- Instead of finding the?mode, when working with a grouped frequency table we instead find the?modal class
- This will be the?class?(group) with the?greatest frequency
- It is only possible to calculate an?estimate?for the?mean?and the?median?from a grouped frequency table
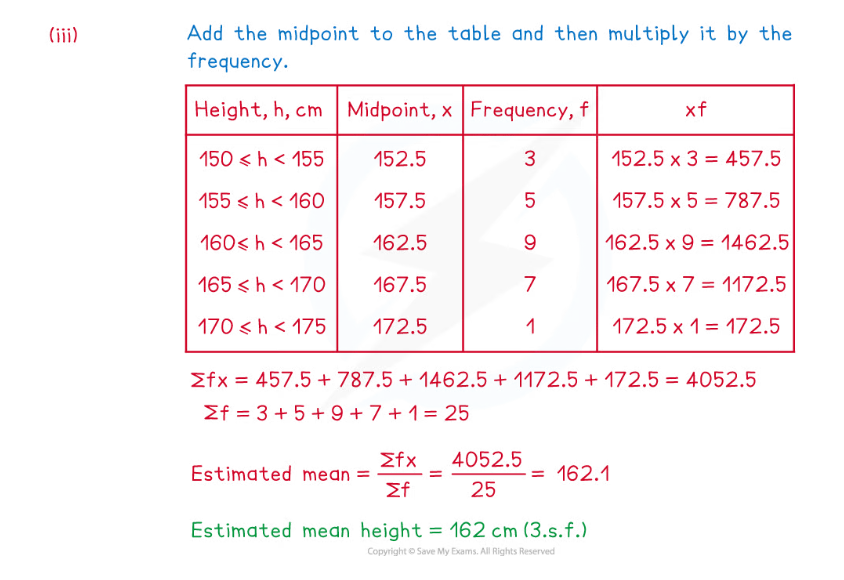
- Calculating the?estimated mean?is the same as for ungrouped frequency tables, however you will need to find the?midpoints?first
- the midpoint is the mean of the upper and lower values in the class boundaries
- multiply the midpoint by its corresponding frequency, find the sum of these values and then divide by

- Calculating the?estimated median?is more complicated and can involve using?linear interpolation
Linear interpolation from grouped data
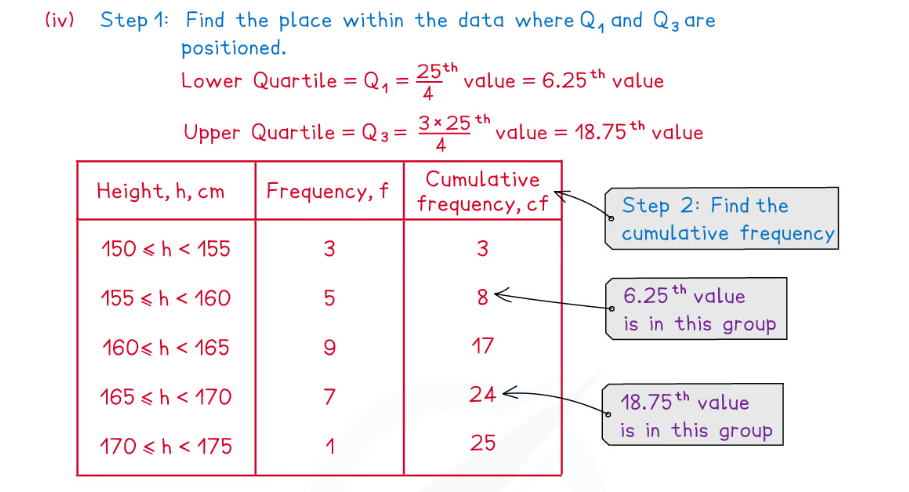
- For grouped data, the?median, quartiles and percentiles?can be found using a process called?linear interpolation
- Interpolation?uses the assumption that the data values are evenly spread throughout each class
- Once you know which data value you are looking for, interpolation uses proportion for find how far through each class the data value should be
- It is important to remember to add on the lower-class boundary after finding the correct data value
- Follow these steps to use linear interpolation to find the median, quartiles or percentiles:
Step 1. Find the place within the data where the value you are looking to find is positioned, e.g. the median will be the  ?th value
Step 2. Add up the frequencies until you know which class this value will fall into (this is finding the cumulative frequency)
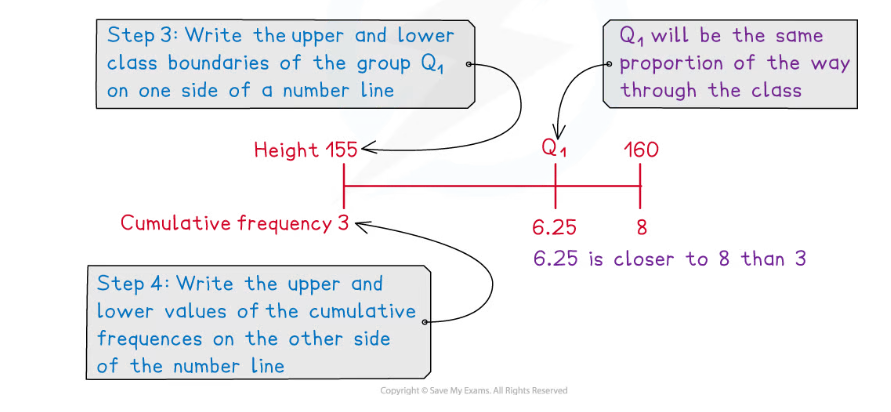
Step 3. Write the upper- and lower-class boundaries of this group on the upper side of a simple number line
Step 4. On the other side of the same number line add the lower and upper values of the?cumulative frequency?for this group to the ends of the line
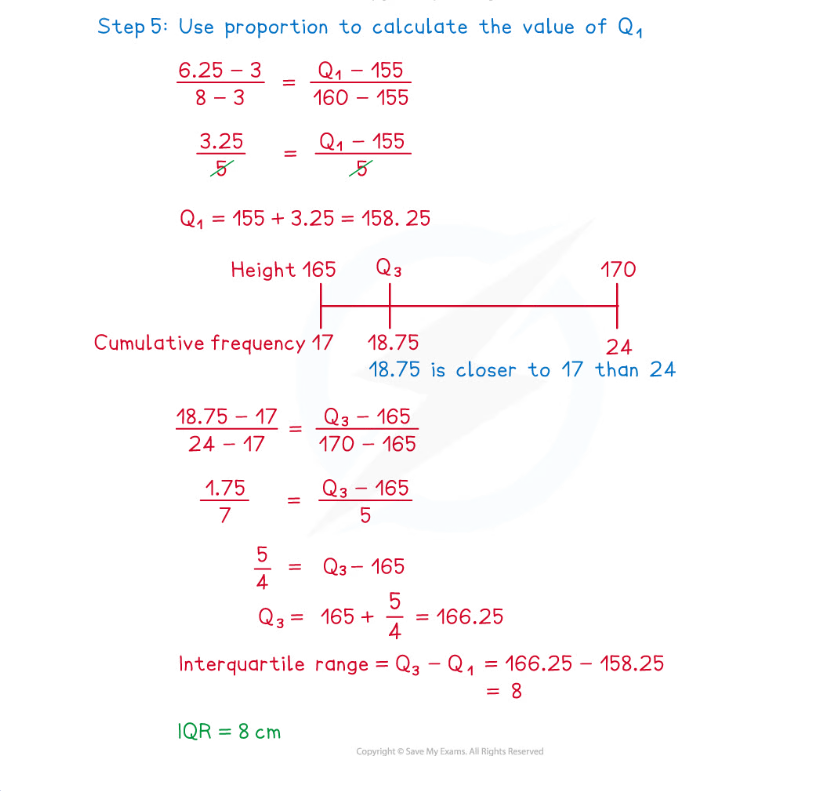
Step 5. Use proportion to calculate the data value that is the same fraction of the way through the group on the upper side of the number line as where the value you are looking for would sit on the lower side of the number line
-
-
- To see these steps in action, go to part (iv) of the worked example
-
- This method can be used to find any percentile, for example the 81st percentile will be the value that is
 ths of the way through the data
Worked Example
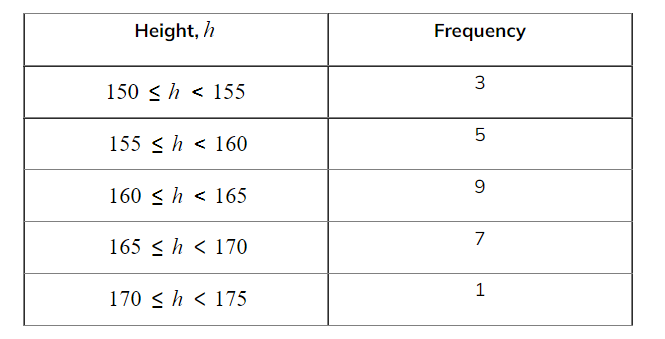
The table below shows the heights in cm of a group of year 12 students.
Exam Tip
- There can be a lot of calculations when working with grouped frequency tables, be extra careful when using your calculators as it is easy to make small errors with these questions. Use the table and add information to the table as you go as there will be marks available for showing work within the methods. Make sure you know how to use your calculator to find all of the summary statistics as this can save time and reduce errors.
轉(zhuǎn)載自savemyexams
以上就是關(guān)于【Edexcel A Level Maths: Statistics:復(fù)習(xí)筆記2.1.2 Frequency Tables】的解答,如需了解學(xué)校/賽事/課程動態(tài),可至翰林教育官網(wǎng)獲取更多信息。
往期文章閱讀推薦:
斯坦福大學(xué)官方推薦書單!名校學(xué)霸們暑假都在讀什么?
MIT官方發(fā)布【2026年夏季推薦閱讀書單】!橫跨科學(xué)/人文/經(jīng)濟(jì)...


翰林AMC8視頻課重磅上線!

國際競賽真題資源免費(fèi)領(lǐng)取






