約翰霍普金斯大學(xué)Carey商學(xué)院項(xiàng)目盤點(diǎn)!
今天小編帶大家了解一下約翰霍普金斯大學(xué)Carey商學(xué)院項(xiàng)目分析,盤點(diǎn)一下具體的項(xiàng)目時(shí)長(zhǎng)、必修選修科目等等。約翰霍普金斯大學(xué)在2022US News世界排名第九,也是很多同學(xué)們的Dream School啦~ Carey商學(xué)院項(xiàng)目分析 B...

今天小編帶大家了解一下約翰霍普金斯大學(xué)Carey商學(xué)院項(xiàng)目分析,盤點(diǎn)一下具體的項(xiàng)目時(shí)長(zhǎng)、必修選修科目等等。約翰霍普金斯大學(xué)在2022US News世界排名第九,也是很多同學(xué)們的Dream School啦~ Carey商學(xué)院項(xiàng)目分析 B...
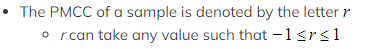
PMCC What is Pearson’s product-moment correlation coefficient? Pearson’s product-moment correlation coefficient (PMCC) is a way of giving a numerical value to a?linear relationship?of bivariate dat...
Scatter Diagrams What does bivariate data mean? Bivariate data?is data which is collected on?two variables?and looks at how one of the factors affects the other Each data value from one variable wi...
Interpreting Data How do I interpret statistical measures? The?mode?is useful for?qualitative data It is not as useful for quantitative data as there is not always a unique mode The?mean includes a...
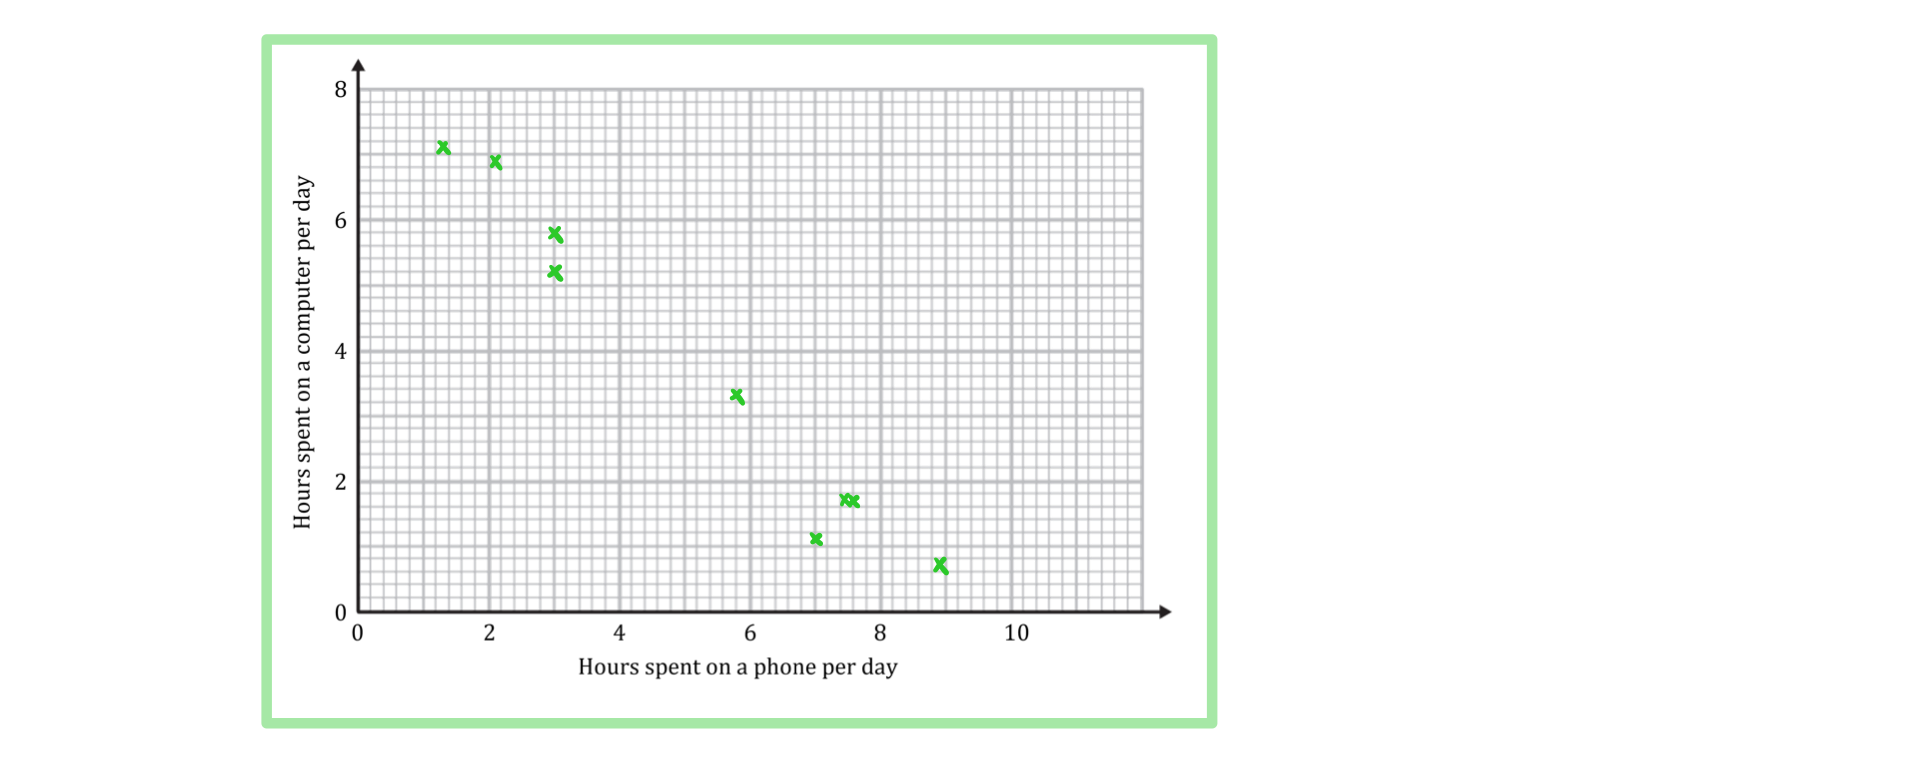
Univariate data is data that is in?one variable. Box Plots What is a box plot (box and whisker diagram)? A box plot is a graph that clearly shows key statistics from a data set It shows the?median,...
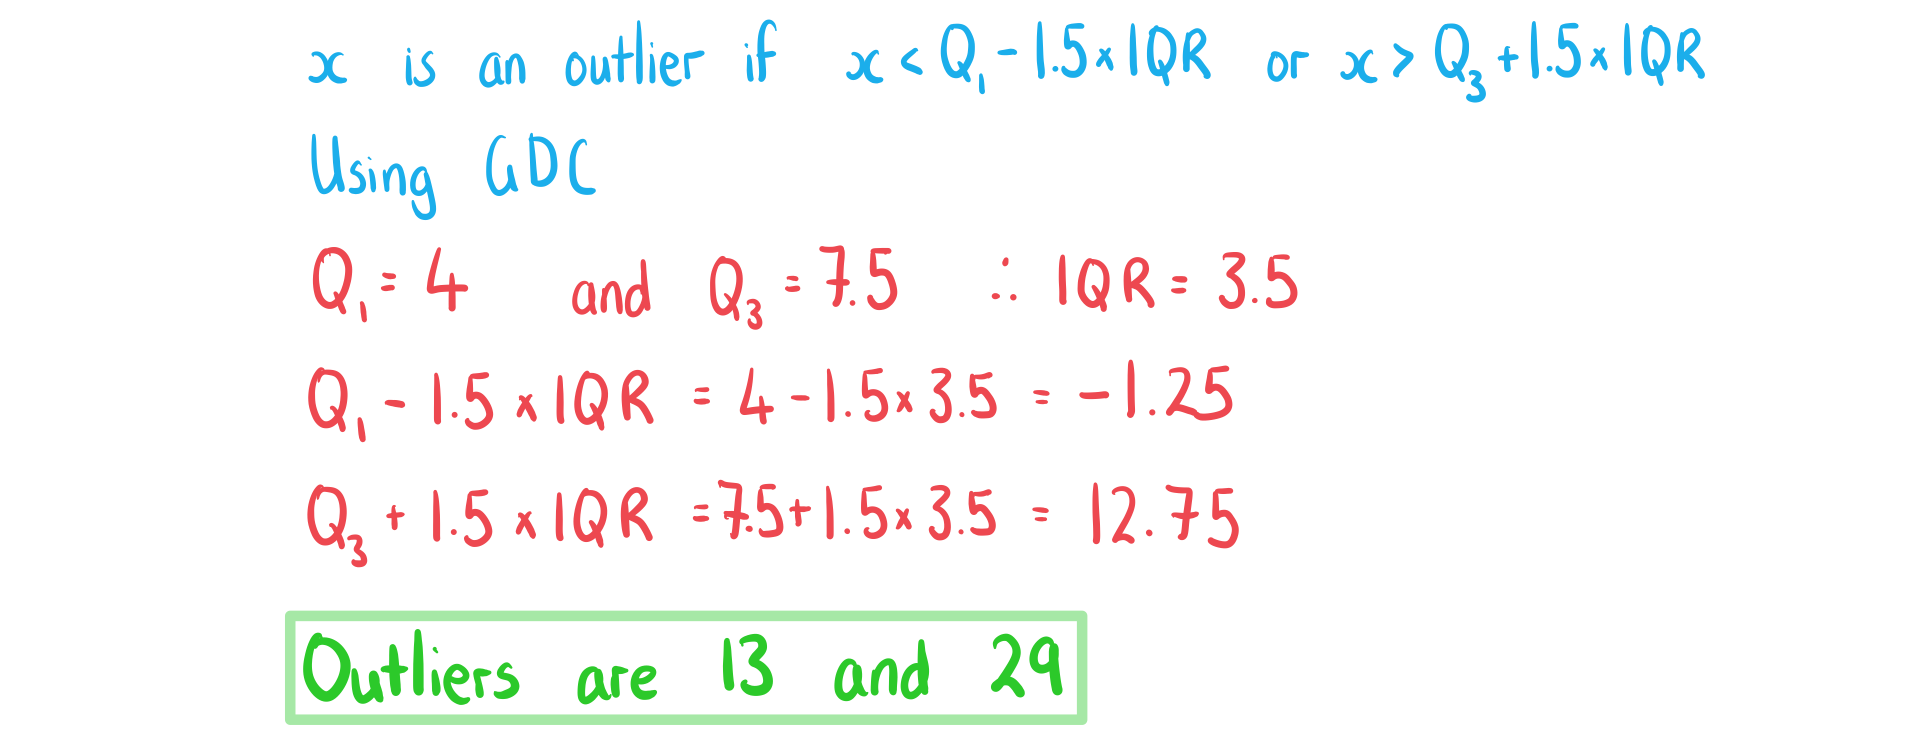
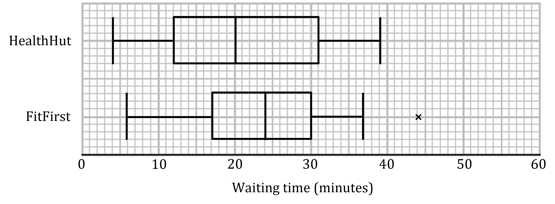
Outliers What are outliers? Outliers are extreme data values that do not fit with the rest of the data They are either a lot bigger or a lot smaller than the rest of the data Outliers are defined a...
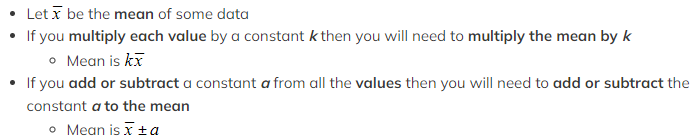
Linear Transformations of Data Why are linear transformations of data used? Sometimes data might be very large or very small You can apply a?linear transformation?to the data to make the values mor...
National History Day(NHD)美國(guó)國(guó)家歷史日學(xué)術(shù)活動(dòng)起源于1974年俄亥俄州創(chuàng)始的地方性歷史學(xué)術(shù)活動(dòng),經(jīng)過(guò)多年的發(fā)展已經(jīng)成為全球性學(xué)術(shù)學(xué)術(shù)活動(dòng)活動(dòng)。每年參賽的學(xué)生超過(guò)50萬(wàn),超過(guò)3萬(wàn)名老師參與其中,除了美國(guó)的...
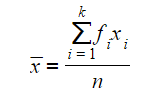
Ungrouped Data How are frequency tables used for ungrouped data? Frequency tables can be used for ungrouped data when you have lots of the same values within a data set They can be used to collect ...


